
Photo: Wikipedia
Demographics of Montpelier, VT
Affluence Level in Montpelier, VT
A middle-class area roughly in line with national averages across income, home values, education, and employment.
People of Montpelier, VT
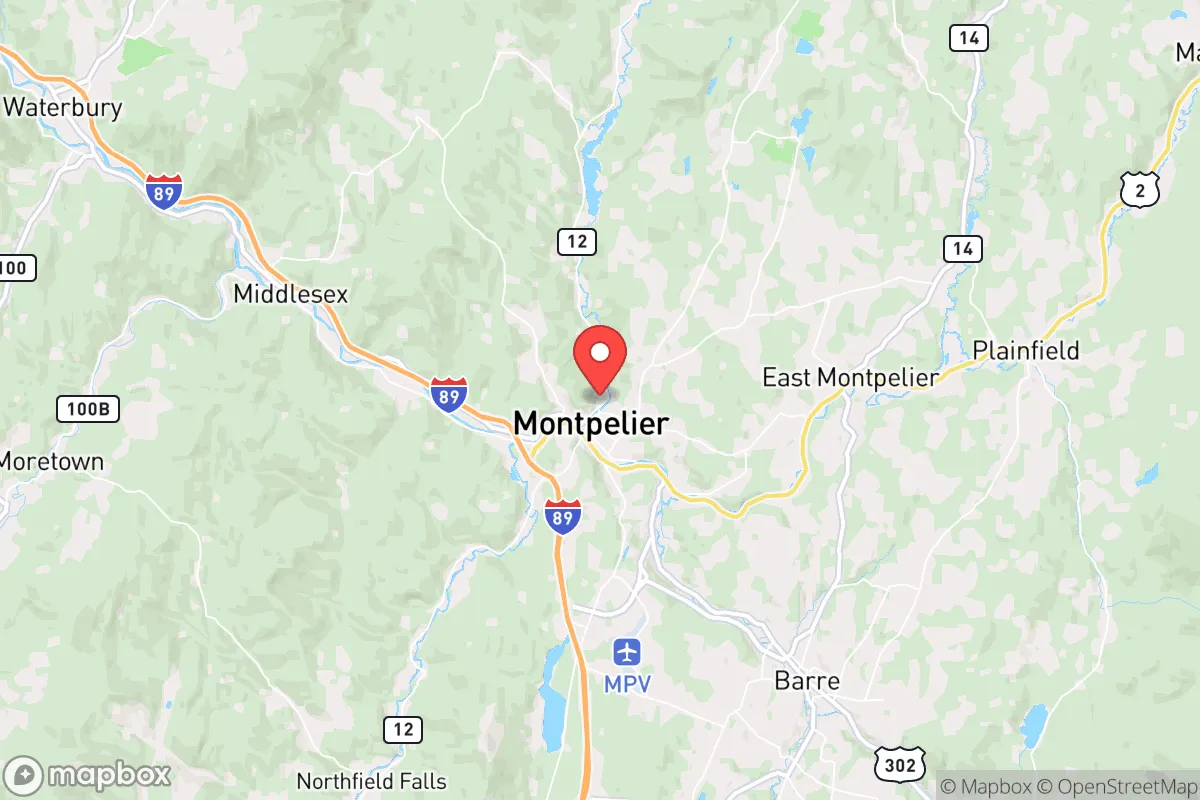
Today, Montpelier, Vermont’s 8,038 residents form one of the most highly educated and politically engaged small-city populations in New England, with 66.2% holding a college degree. The city is overwhelmingly white (87.7%) and native-born (only 2.0% foreign-born), with a small but visible Hispanic (4.1%) and Indian-subcontinent (1.1%) presence. Its character is defined less by ethnic enclaves than by a dense, walkable downtown core—the smallest state capital in the U.S.—where state government workers, nonprofit professionals, and retirees live alongside a modest student population from Vermont College of Fine Arts. The city’s identity is distinctly progressive and civic-minded, with a population density (roughly 1,100 per square mile) that feels urban for Vermont but suburban by national standards.
How the city was settled and grew
Montpelier’s original population was drawn by the Winooski River’s waterpower and the promise of fertile valley land after the 1781 charter. The first wave—English-descended farmers and millwrights from southern New England—built the Downtown district along State Street and the riverfront, where gristmills and sawmills clustered. By the 1830s, the arrival of the Central Vermont Railroad turned the North End (around today’s Elm and Northfield Streets) into a working-class Irish neighborhood, as laborers dug the rail bed and built the depot. A second wave of French-Canadian mill workers settled in East Montpelier Village (a distinct hamlet within the city limits) during the 1870s–1890s, drawn by the granite sheds and the granite-finishing industry that made Montpelier a regional stoneworking hub. These groups remained largely separate: the English-descended elite lived on College Street and Hillside Avenue, while the Irish and French-Canadian families concentrated in the flatter, flood-prone areas near the river. By 1900, the city was 98% white and overwhelmingly native-born of European descent, a pattern that held through the mid-20th century as state government expanded and replaced manufacturing as the primary employer.
Modern era (post-1965)
The 1965 Hart-Cellar Act had minimal effect on Montpelier’s demographics—the city’s foreign-born share never exceeded 3% in any census. Instead, the post-1965 story is one of domestic in-migration: college-educated professionals from the Northeast Corridor, drawn by state government jobs, the University of Vermont’s proximity, and the city’s reputation as a liberal enclave. These newcomers settled primarily in the Berlin Street corridor and the Pioneer Street area, where older single-family homes were subdivided into rentals and condos. The city’s small Hispanic population (4.1%) is concentrated in the Downtown and North End rental stock, largely employed in hospitality and service roles. The Indian-subcontinent community (1.1%) is almost entirely tied to professional positions—doctors at Central Vermont Medical Center and faculty at Vermont Law School in nearby South Royalton—and lives scattered across College Street and the East Montpelier Village area, with no single ethnic enclave. East/Southeast Asian residents (0.6%) are similarly dispersed, often graduate students or tech workers. The Black population (1.1%) is small and largely concentrated in the Downtown rental market. Since 2000, the city has become slightly more diverse—the white share dropped from 95.1% to 87.7%—but the change is driven almost entirely by the growth of the Hispanic and Indian-subcontinent populations, not by a broad multi-ethnic influx.
The future
Montpelier’s population is aging and slowly shrinking—the city lost roughly 200 residents between 2010 and 2020—and the next decade will likely see continued homogenization by education and income rather than by race. The foreign-born share (2.0%) is unlikely to rise significantly, as Vermont’s restrictive housing supply and high cost of living deter immigrant settlement. The Hispanic and Indian-subcontinent communities are growing but from a tiny base; they are more likely to assimilate into the city’s professional class than to form distinct ethnic neighborhoods. The real demographic story is the concentration of college-educated, left-leaning professionals who are pricing out the remaining working-class families—both white and non-white—from the Downtown and College Street areas. The North End and East Montpelier Village remain the most affordable pockets, but even there, home prices have doubled since 2015. For a conservative-leaning newcomer, the city’s population trajectory means moving into a place that is becoming more ideologically uniform, less economically diverse, and less family-oriented—a trade-off between civic engagement and cultural homogeneity.
Montpelier is becoming a smaller, older, and more professionally stratified city—a state-government company town where the working class is being replaced by the degree-holding class. For someone moving in now, the city offers a safe, walkable, and highly educated environment, but with little ethnic diversity and a political culture that leans uniformly progressive. The neighborhoods to watch are the North End for relative affordability and the College Street corridor for professional networks; the Downtown remains the social and civic heart, but is increasingly unaffordable for anyone not in the top income quintile.
* Values derived from national, state, county, city and local statistics and may differ in a specific area. Last updated: 2026-05-02T00:47:26.000Z
Narrative content on this page is AI-generated and may contain mistakes. Verify any details that matter before acting on them.
ReloMaps may earn a commission from affiliate links at no extra cost to you.