Photo: Wikipedia
Demographics of Nashville, TN
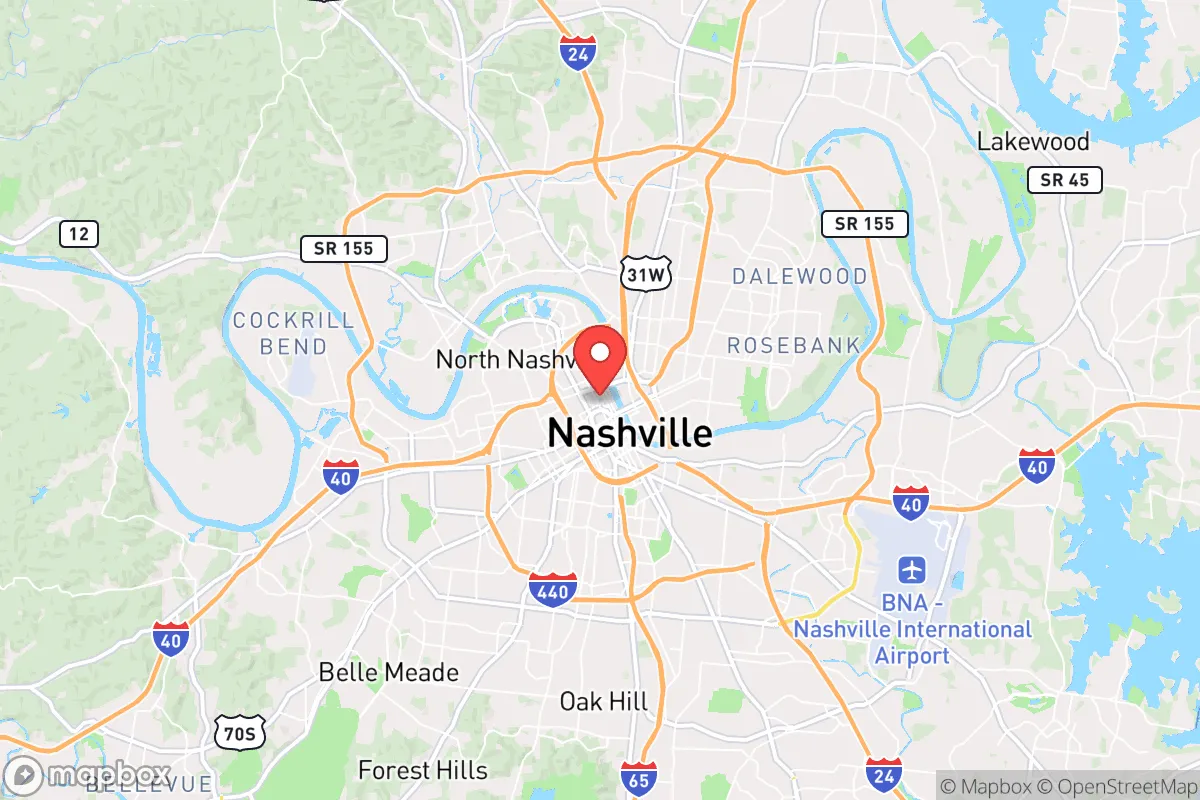
Affluence Level in Nashville, TN
A middle-class area roughly in line with national averages across income, home values, education, and employment.
People of Nashville, TN
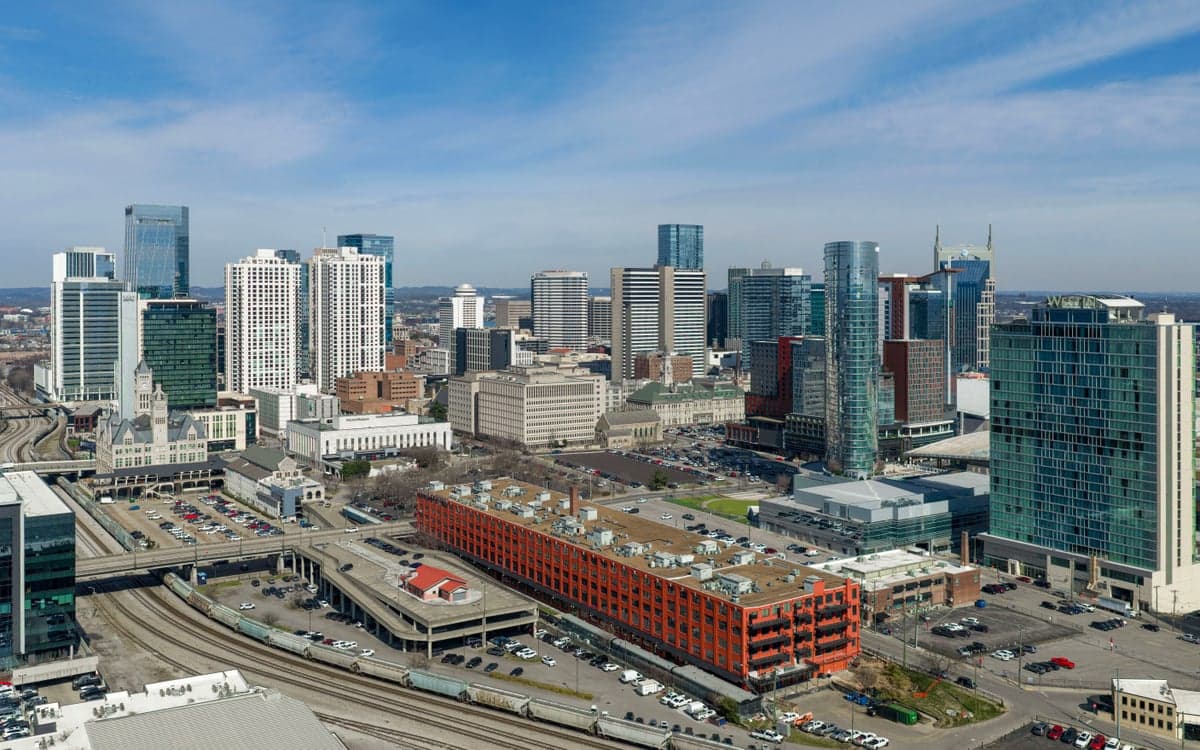
Nashville’s 684,298 residents form a city that is simultaneously Southern, cosmopolitan, and deeply stratified by class and geography. It is a majority-white city (52.9%) with a substantial Black population (25.2%) and a fast-growing Hispanic community (13.8%), while East/Southeast Asian residents (2.5%) and Indian-subcontinent residents (0.9%) represent smaller but distinct enclaves. The city’s identity is shaped by its role as a conservative-leaning state capital, a global music industry hub, and a magnet for young professionals, yet its neighborhoods remain notably segregated by race and income, with historic patterns of settlement still visible in the built environment.
How the city was settled and grew
Nashville was founded in 1779 as a frontier outpost on the Cumberland River, drawing Anglo-American settlers from Virginia and North Carolina who claimed land grants under the short-lived State of Franklin. The city’s early growth was driven by the river trade, then by railroads and the rise of the printing and publishing industry in the 19th century. By the Civil War, Nashville had a significant free Black population, and after Reconstruction, freedmen established neighborhoods like North Nashville and Edgehill, which became centers of Black commerce and education, anchored by Fisk University and Meharry Medical College. European immigrants—primarily German and Irish—arrived in the mid-1800s, settling in Germantown (north of downtown) and working as laborers, brewers, and artisans. The city’s population grew steadily through the early 1900s, reaching 167,000 by 1930, with the Great Migration bringing tens of thousands of Black Southerners from rural Tennessee and Alabama into neighborhoods like South Nashville and Bordeaux.
Modern era (post-1965)
The 1965 Hart-Celler Act opened immigration channels that reshaped Nashville’s population, though the city’s foreign-born share remains modest at 9.6% compared to national averages. The most visible post-1965 wave has been Hispanic migration, which accelerated in the 1990s and 2000s as construction, hospitality, and service industries boomed. Today, Hispanic residents are concentrated in South Nashville (particularly along Nolensville Pike) and Antioch, where Mexican, Central American, and some Cuban families have established churches, bodegas, and community centers. East/Southeast Asian communities—primarily Vietnamese, Laotian, and Korean—arrived as refugees and immigrants after the Vietnam War, settling in Charlotte Park and parts of West Nashville, where a small but stable Asian commercial corridor exists. Indian-subcontinent residents, a separate group in our data, are a more recent and highly educated wave, drawn by jobs in healthcare and tech; they cluster in Brentwood and Green Hills (suburbs and affluent in-town neighborhoods), with a growing presence in the midtown area. Meanwhile, domestic in-migration has been the dominant force since 2010: white college-educated professionals from the Northeast, Midwest, and California have flooded into The Gulch, 12 South, and East Nashville, driving gentrification and displacing long-time Black residents from historically Black neighborhoods. The city’s Black population share has declined from 38% in 1980 to 25.2% today, even as the absolute number of Black residents has grown slightly, reflecting both suburbanization and out-migration to Atlanta and other Southern metros.
The future
Nashville’s population is trending toward greater ethnic diversity but also sharper geographic sorting. Hispanic and East/Southeast Asian communities are growing steadily, though from small bases, and are likely to continue expanding in South Nashville and Antioch as chain migration and family reunification persist. The Indian-subcontinent population, while tiny at 0.9%, is growing rapidly due to H-1B visa holders and medical professionals, and will likely concentrate further in affluent suburbs like Brentwood and Franklin rather than within city limits. The white population, now 52.9%, is being replenished by domestic migrants, but the city’s high cost of living (median home price above $450,000) is beginning to slow in-migration from outside the South. The most significant demographic trend is the ongoing displacement of Black residents from core neighborhoods to outlying suburbs like La Vergne and Madison, a pattern that mirrors the broader Sun Belt pattern of Black suburbanization. Over the next 10–20 years, Nashville will likely become a more Hispanic and Asian city, but its fundamental character—a majority-white, college-educated professional class in the urban core, with a Black population increasingly suburban, and a Hispanic working class in the southern corridor—will persist.
For a conservative-leaning individual or family moving to Nashville today, the city offers a dynamic economy and a culturally conservative state government, but the local population is increasingly polarized by education and income. The neighborhoods that feel most stable and family-oriented—like Brentwood, Green Hills, or Bellevue—are predominantly white and affluent, while the city’s historic Black and Hispanic enclaves face ongoing pressure from redevelopment. Understanding where each group settled and why is essential to choosing a neighborhood that aligns with one’s priorities for schools, safety, and community.
* Values derived from national, state, county, city and local statistics and may differ in a specific area. Last updated: 2026-04-22T01:24:46.000Z
Narrative content on this page is AI-generated and may contain mistakes. Verify any details that matter before acting on them.
ReloMaps may earn a commission from affiliate links at no extra cost to you.