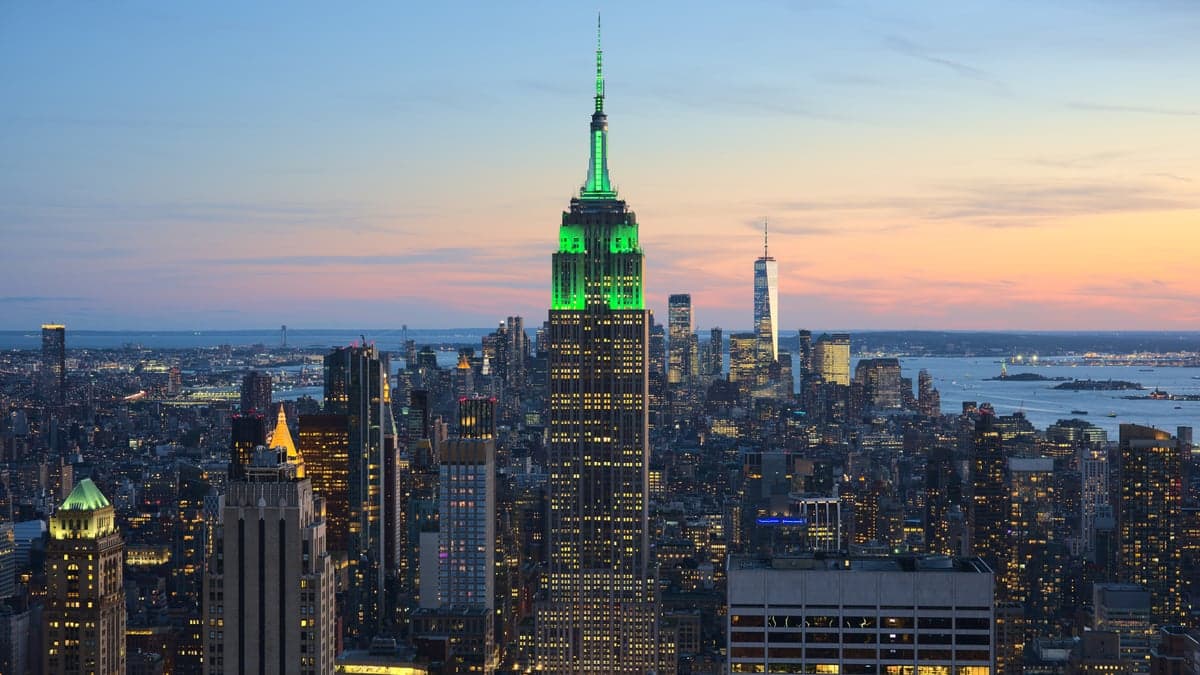
Photo: Wikipedia
Demographics of New York, NY
Affluence Level in New York, NY
A middle-class area roughly in line with national averages across income, home values, education, and employment.
People of New York, NY
New York City’s 8.5 million residents form the densest, most ethnically layered population in the United States — a place where 41% of adults hold a college degree yet the foreign-born share (15%) is lower than in many smaller gateway cities. The city’s identity is defined by extreme racial and economic diversity: 31.3% white, 28.4% Hispanic, 20.8% Black, 10.0% East/Southeast Asian, and 4.5% Indian subcontinent. No single group dominates, and the city’s neighborhoods remain among the most segregated in the nation by both income and ethnicity, creating a patchwork of distinct enclaves rather than a melting pot.
How the city was settled and grew
New York’s population history begins with Dutch fur traders who founded New Amsterdam in 1624 at the southern tip of Manhattan, now the Financial District. The English took control in 1664, renamed it New York, and the city grew as a deep-water port and commercial hub. The 19th century brought the first massive wave: Irish and German immigrants fleeing famine and political upheaval, settling in Five Points (now part of Chinatown) and the Lower East Side. By 1900, Eastern European Jews and Italians dominated these same tenement districts, while African Americans from the post-Reconstruction South began forming a community in San Juan Hill (later displaced by Lincoln Center) and Harlem. Puerto Ricans arrived in large numbers after World War II, concentrating in East Harlem (Spanish Harlem) and the South Bronx. Each wave built the city’s infrastructure — subways, garment factories, docks — and created the ethnic neighborhoods that still bear their imprint.
Modern era (post-1965)
The 1965 Hart-Cellar Act reshaped New York’s population dramatically. The city’s white share fell from roughly 70% in 1960 to 31.3% today, driven by suburban flight to Long Island, New Jersey, and Westchester. Simultaneously, new immigration from Asia and Latin America surged. Flushing, Queens became the anchor for East/Southeast Asian communities — Chinese, Korean, and Taiwanese — now the largest Asian enclave on the East Coast. Jackson Heights, Queens evolved into a hyper-diverse corridor of South American, Mexican, and Indian subcontinent families. The Indian population (4.5% citywide) concentrates heavily in Richmond Hill, Queens (Guyanese and Indo-Caribbean) and Murray Hill, Queens (Indian subcontinent professionals). Black New Yorkers, once concentrated in Harlem and Bedford-Stuyvesant, have seen significant out-migration to the suburbs and the South since 2000, while new Black immigrant groups from West Africa and the Caribbean have moved into the Bronx and Flatbush, Brooklyn. Hispanic growth has plateaued at 28.4%, with Puerto Rican and Dominican populations aging and Mexican and Central American communities expanding in Sunset Park, Brooklyn and Corona, Queens.
The future
New York’s population is slowly homogenizing by class even as it remains racially diverse. The city lost roughly 5% of its population between 2020 and 2024, driven by remote-work exodus and high housing costs, and the recovery has been uneven. White and Asian populations are growing in formerly Black and Hispanic neighborhoods like Harlem and Bushwick, accelerating gentrification. The East/Southeast Asian share (10.0%) is likely to rise modestly through continued immigration and higher birth rates, while the Indian subcontinent population (4.5%) is growing faster due to tech and finance recruitment. Hispanic growth has slowed to near zero, and the Black share continues a decades-long decline from a peak of 25% in 1990. The city is not tribalizing into new enclaves so much as consolidating into a two-tier system: affluent, college-educated professionals (white, Asian, Indian) in gentrified core neighborhoods, and lower-income, less-educated residents (Hispanic, Black, immigrant) pushed to the outer boroughs and inner suburbs.
For a conservative-leaning mover, New York City is becoming a place where traditional ethnic neighborhoods are dissolving into a more economically stratified, less family-oriented landscape. The city’s high cost of living, declining public-school enrollment, and rising crime concerns in certain precincts make it a challenging choice for parents. However, the density of professional opportunity, cultural institutions, and elite private schools remains unmatched. The population trajectory suggests continued growth in high-income Asian and Indian enclaves, stagnation in Hispanic and Black communities, and a slow overall shrinkage — a city that rewards the affluent and squeezes everyone else.
* Values derived from national, state, county, city and local statistics and may differ in a specific area. Last updated: 2026-04-15T19:12:32.000Z
Narrative content on this page is AI-generated and may contain mistakes. Verify any details that matter before acting on them.
ReloMaps may earn a commission from affiliate links at no extra cost to you.