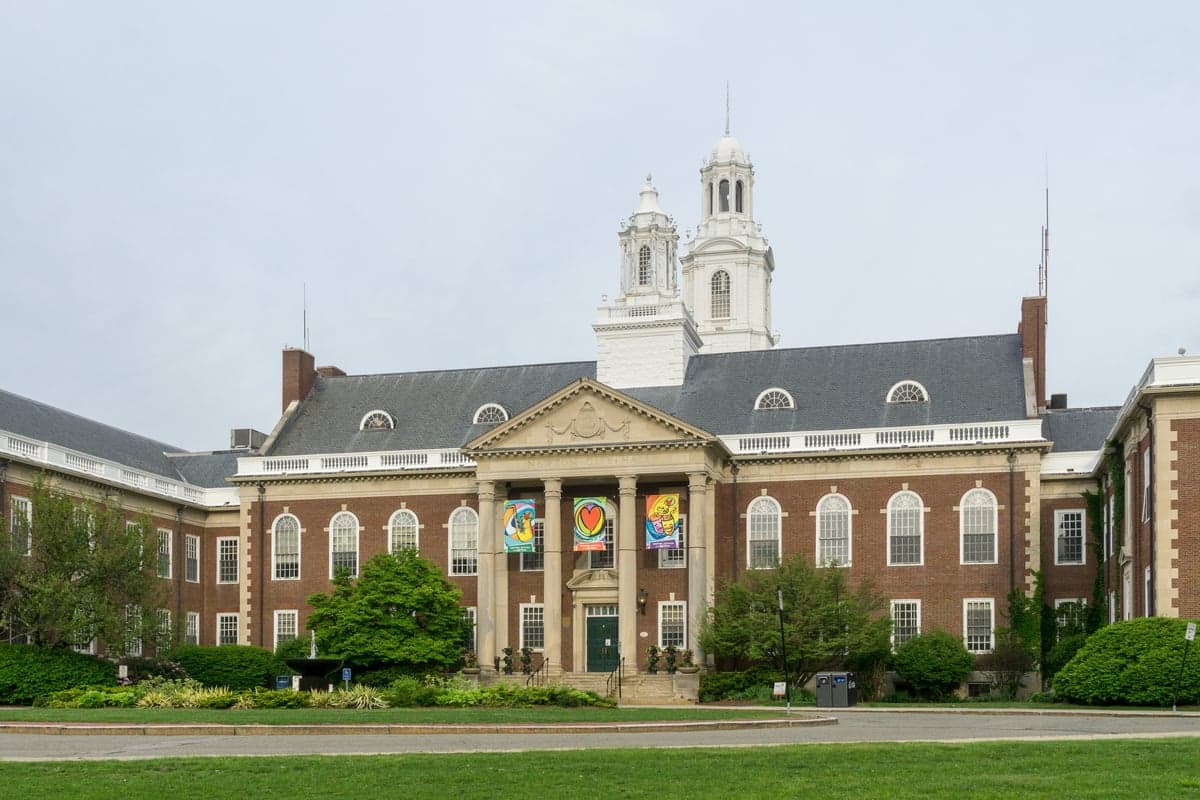
Photo: Wikipedia
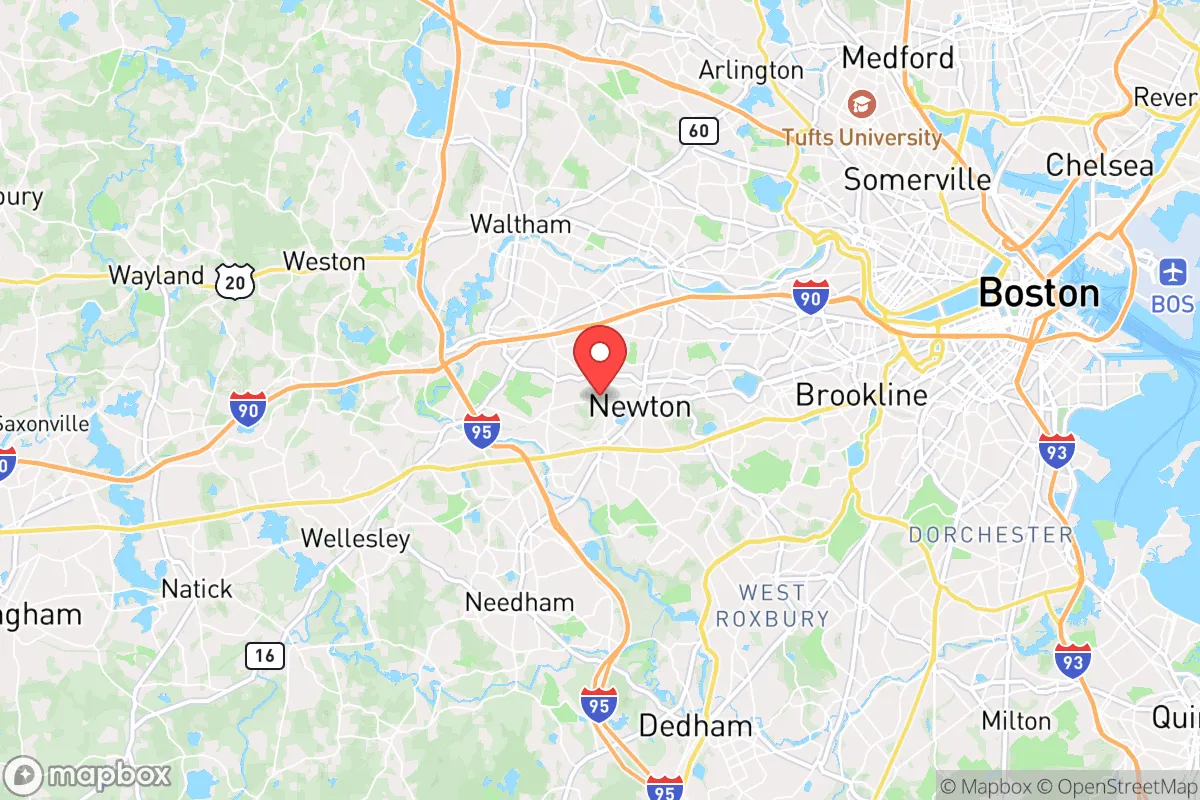
Demographics of Newton, MA
Affluence Level in Newton, MA
A wealthy area with high-earning, well-educated households. Incomes, home values, and educational attainment meaningfully outpace national averages.
People of Newton, MA
Newton, Massachusetts, is a densely settled city of 88,504 residents that blends historic New England character with the professional gravitas of a top-tier Boston suburb. Its population is notably well-educated—80.7% hold a college degree—and predominantly white (69.8%), with a significant and growing East/Southeast Asian community (13.7%) and a smaller Indian-subcontinent population (2.8%). The city’s identity is shaped by its village-centered layout, strong public schools, and a political culture that leans progressive, though its historic neighborhoods retain distinct ethnic and economic imprints from earlier waves of settlement.
How the city was settled and grew
Newton’s human history begins with its 1688 incorporation as a farming community, “Cambridge Village,” carved from the original Cambridge grant. The first settlers were English Puritans seeking arable land along the Charles River, and they established the village center around what is now Newton Centre. The 19th century brought two transformative forces: the Boston & Albany Railroad and the industrial boom along the Charles. The railroad made Newton a commuter suburb for Boston’s merchant and professional classes, and grand Victorian homes rose in Newton Corner and Waban, attracting wealthy Anglo-Protestant families. Simultaneously, Irish immigrants arrived to work in the city’s mills and on the railroad, settling in Nonantum (the “Lake” area) and Newton Lower Falls, where they built St. Bernard’s Church and established a lasting Irish-Catholic presence. By 1900, Newton was a patchwork of distinct villages—each with its own commercial center and ethnic character—and its population had swelled to over 33,000, driven by streetcar suburbs and the annexation of neighboring towns.
Modern era (post-1965)
The 1965 Hart-Celler Act reshaped Newton’s demographics by opening immigration from Asia. The first wave of East/Southeast Asian families—primarily Chinese and Taiwanese professionals—arrived in the 1970s and 1980s, drawn by the city’s top-ranked public schools and proximity to Boston’s universities and tech employers. They concentrated in Newton Highlands and Newton Centre, where homes near the commuter rail offered easy access to jobs. A second, larger wave of Chinese and Korean immigrants arrived in the 2000s, often buying in Auburndale and West Newton, where newer housing stock and slightly lower prices appealed to dual-income families. The Indian-subcontinent population, though smaller at 2.8%, grew steadily after 2000, with many families settling in Newton Upper Falls and the southern edge of Newton Centre. Meanwhile, the city’s white population aged in place, and younger white families increasingly chose Newton for its schools, though at a slower rate than in the 1990s. The Hispanic (4.8%) and Black (2.1%) populations have remained relatively stable, concentrated in the more affordable rental stock near Newton Corner and along the Washington Street corridor. The foreign-born share (8.1%) is lower than in neighboring Cambridge or Brookline, reflecting Newton’s status as a high-cost, family-oriented suburb where immigration is primarily driven by professional-class Asians, not low-wage labor.
The future
Newton’s population is heading toward greater ethnic diversity, but within a framework of economic and educational stratification. The East/Southeast Asian community is the fastest-growing segment, projected to approach 18-20% of the population by 2040, driven by continued professional immigration and high birth rates among established families. These families are increasingly moving into Waban and Chestnut Hill, where large homes and top-tier elementary schools command premiums. The Indian-subcontinent population is also growing, though more slowly, and is likely to remain concentrated in the southern villages. The white population is declining gradually as older residents downsize or move to retirement communities, and younger white families face affordability pressures that push them to suburbs like Needham or Lexington. The city is not tribalizing into ethnic enclaves—most neighborhoods remain mixed—but distinct patterns persist: Nonantum remains heavily Irish-Catholic, Auburndale has a visible Chinese presence, and Newton Upper Falls draws Indian families. The biggest demographic unknown is housing supply: Newton’s restrictive zoning and high prices limit in-migration, so future growth will likely come from denser development near the commuter rail stations, which could attract more young professionals and immigrant families.
For someone moving to Newton now, the city offers a stable, high-opportunity environment with a population that is becoming more Asian and more educated, but also older and more expensive. The historic village character remains intact, but the social fabric is increasingly defined by school catchment areas and real estate prices rather than ethnic neighborhoods. Newton is not becoming a melting pot—it is becoming a stratified, high-achieving suburb where demographic change is real but gradual, and where newcomers will find a community that values education, civic engagement, and property values above all else.
* Values derived from national, state, county, city and local statistics and may differ in a specific area. Last updated: 2026-05-01T10:33:13.000Z
Narrative content on this page is AI-generated and may contain mistakes. Verify any details that matter before acting on them.
ReloMaps may earn a commission from affiliate links at no extra cost to you.