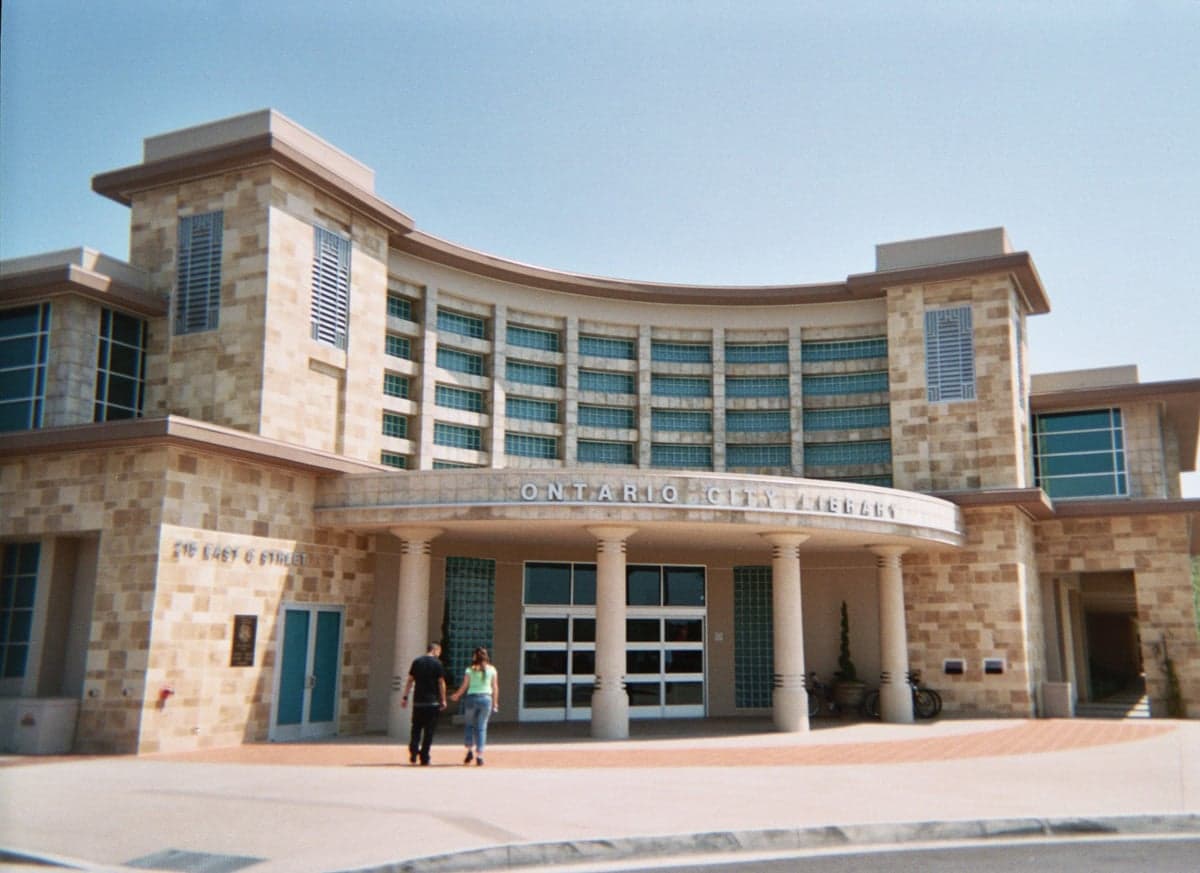

Photo: Wikipedia
Quality of Life in Ontario, CA
A high quality of life with strong walkability, manageable living costs, healthy neighborhood signals, and solid amenity access.
What does Quality of Life tell us?
Quality of Life blends cost of living, nearby amenities, socioeconomic signals, and neighborhood character. City-level scores represent the whole municipality; individual neighborhoods can differ.
What does this tell us?
Quality of Life blends cost of living, nearby amenities, socioeconomic signals, and neighborhood character. City-level scores represent the whole municipality; individual neighborhoods can differ.
Cost of Living
79% above national average
The Real Cost of Living in Ontario, CA for 2026
| Tier | Individual | Family (4) |
|---|---|---|
| Survival | $30k | $57k |
| Comfortable | $85k | $125k |
| Luxury | $124k+ | $193k+ |
| Elite (Top 5%) | $146k+ | $227k+ |
66%
The Area Signal
A metric tracking the socioeconomic signals of the area.
Hobbies
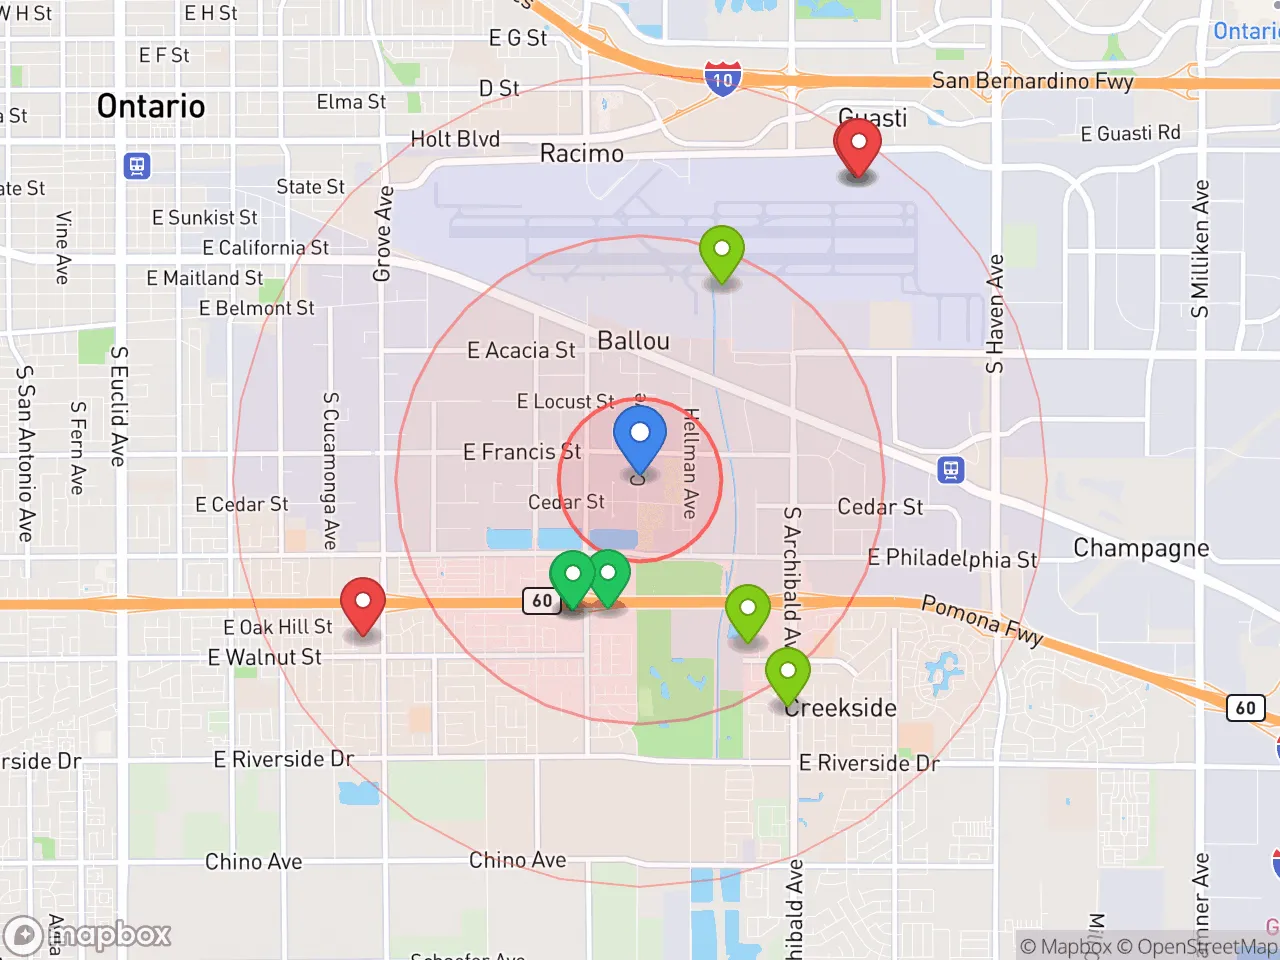
Explore the areaGroceries
8 within 10 miles
Gas
20 within 10 miles
Hospital
20 within 20 miles
Airport
SAN — San Bernardino International
Post Office
USPS — Ontario, CA
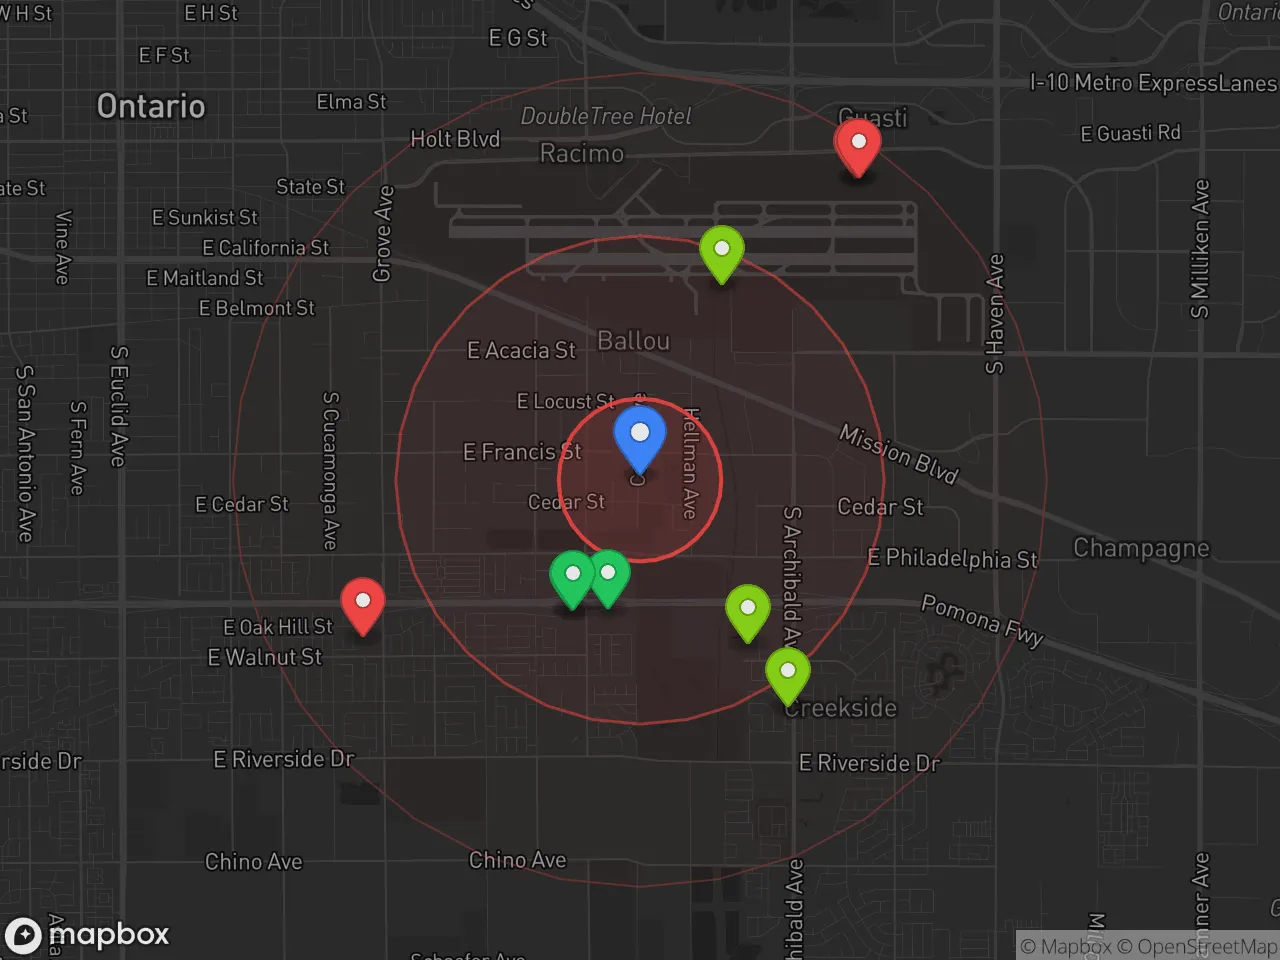
Critical Amenities
Quality-of-Life Analysis
Ontario, California, presents a quality-of-life profile defined by its position as a relatively affordable gateway within the high-cost Inland Empire, attracting a diverse mix of long-term families, first-time homebuyers, and commuters priced out of Los Angeles and Orange County. With a cost of living index of 179 (79% above the U.S. average), the city is not cheap by national standards, but it offers a tangible value proposition compared to coastal neighbors. The population is predominantly working- and middle-class, with a strong Latino and Asian community presence, and the city’s character is shaped by its blend of logistics-industry employment, suburban tract homes, and a growing civic core.
Cost of living, housing affordability, and how Ontario compares to nearby cities
Ontario’s cost of living is the primary driver for many relocations, sitting well below the extremes of Los Angeles County while still demanding a significant household income. The median home value of $568,000 is roughly $200,000 less than the Los Angeles County median and about $150,000 less than neighboring Chino Hills, making it one of the more attainable homeownership markets in the western Inland Empire. Median rent of $1,916 is similarly competitive, often $400–$600 per month cheaper than comparable rentals in Orange County. However, the trade-off is a punishing average commute of 31.6 minutes, which for many residents stretches to 45–60 minutes when driving to jobs in Anaheim, Irvine, or downtown Los Angeles via the congested I-10 and CA-60 freeways. Property taxes are kept in check by Proposition 13, but buyers should note that Mello-Roos community facility district fees are common in newer developments, adding $100–$300 to monthly housing costs.
Everyday amenities, schools, and the daily rhythm of life in Ontario
Daily life in Ontario revolves around a practical, car-dependent suburban routine anchored by major retail and employment hubs. The Ontario Mills mall and the surrounding Ontario Ranch area provide extensive shopping and dining, while the city’s 40+ parks and the Cucamonga-Guasti Regional Park offer outdoor recreation. The Ontario International Airport (ONT) is a major convenience, providing direct flights to dozens of U.S. cities and reducing the need to drive to LAX. The Ontario-Montclair School District and Chaffey Joint Union High School District serve most families, with schools like Colony High School and Vina Danks Middle School receiving mixed ratings—some elementary schools are highly rated, but high school performance varies significantly by neighborhood. The city’s rhythm is heavily influenced by the logistics sector: early morning and late afternoon traffic spikes around the warehouse districts near Milliken Avenue and the I-10, while weekends see families at the Ontario Town Square events or the nearby Victoria Gardens cultural center in Rancho Cucamonga. Healthcare access is solid, with Kaiser Permanente Ontario and San Antonio Regional Hospital in nearby Upland providing comprehensive services.
Ontario is best suited for households that prioritize space and homeownership over a short commute—particularly dual-income families and remote workers who can tolerate the drive a few days a week. Singles and couples without children may find the city’s suburban sprawl and limited nightlife less appealing, but for those seeking a stable, family-oriented environment with a lower entry price than coastal California, Ontario delivers a functional, if traffic-heavy, quality of life. The city’s ongoing investment in the Ontario Ranch master-planned community and the revitalization of its historic downtown suggest improving amenities, but the core trade-off of affordability versus commute time remains the defining factor for anyone considering a move here.
Crime in Ontario, CA
Crime rates similar to the national median for U.S. locations.
Violent CrimeViolent Crime Analysis
Property CrimeProperty Crime Analysis
Crime Analysis
Ontario, California, presents a mixed safety profile that demands careful consideration from potential residents. The city's violent crime rate of 328.5 incidents per 100,000 residents is notably lower than the national average, but its property crime rate of 1,394.1 per 100,000 exceeds the national benchmark. However, the broader context of San Bernardino County and California's progressive criminal justice policies introduces significant concerns about recidivism and public safety that go beyond these raw numbers.
Crime in context
Ontario's violent crime rate sits roughly 10% below the national average, a figure that might initially appear reassuring. However, this statistic must be weighed against California's statewide trends. The state's Proposition 47, which reclassified many nonviolent felonies as misdemeanors, and a network of progressive district attorneys—including San Bernardino County's own Jason Anderson, who has faced criticism for lenient charging policies—have contributed to a revolving-door justice system. Property crime in Ontario is nearly 30% higher than the national rate, a direct consequence of policies that deprioritize prosecution for theft, shoplifting, and drug possession. Residents in neighboring cities like Rancho Cucamonga and Upland report similar frustrations, with organized retail theft rings operating with impunity due to soft-on-crime judicial approaches.
What residents experience
Daily life in Ontario involves navigating a heightened risk of property-related offenses. Car burglaries, package thefts, and home break-ins are common complaints, particularly in areas near the Ontario Mills Mall and the airport corridor. The city's police department has implemented targeted patrols and a real-time crime center using license plate readers, but these measures are often undermined by a court system that releases repeat offenders on zero-bail or diversion programs. For families, this means investing in security systems, avoiding parking in poorly lit areas, and remaining vigilant about locking doors and windows. The Ontario Police Department's response times average under 8 minutes for priority calls, but the effectiveness of that response is blunted when arrested individuals are quickly back on the street.
Neighborhood-level variation
Safety in Ontario is not uniform. The southern neighborhoods near the 60 freeway and the Colonies at San Antonio generally report lower crime rates, benefiting from higher property values and active homeowners' associations. In contrast, areas around Euclid Avenue and the downtown core experience more concentrated property crime and occasional violent incidents. The New Haven and Park Place neighborhoods have seen increased gang-related activity, though overall violent crime remains below city averages. Prospective residents should prioritize properties with gated access, garage parking, and proximity to the police substation on East Holt Boulevard. Ultimately, Ontario's safety picture is one where individual precautions and neighborhood selection matter more than citywide averages, especially given the systemic failures of California's progressive justice system.
* Values derived from national, state, county, city and local statistics and may differ in a specific area. Last updated: 2026-04-24T11:46:54.000Z
Narrative content on this page is AI-generated and may contain mistakes. Verify any details that matter before acting on them.
ReloMaps may earn a commission from affiliate links at no extra cost to you.