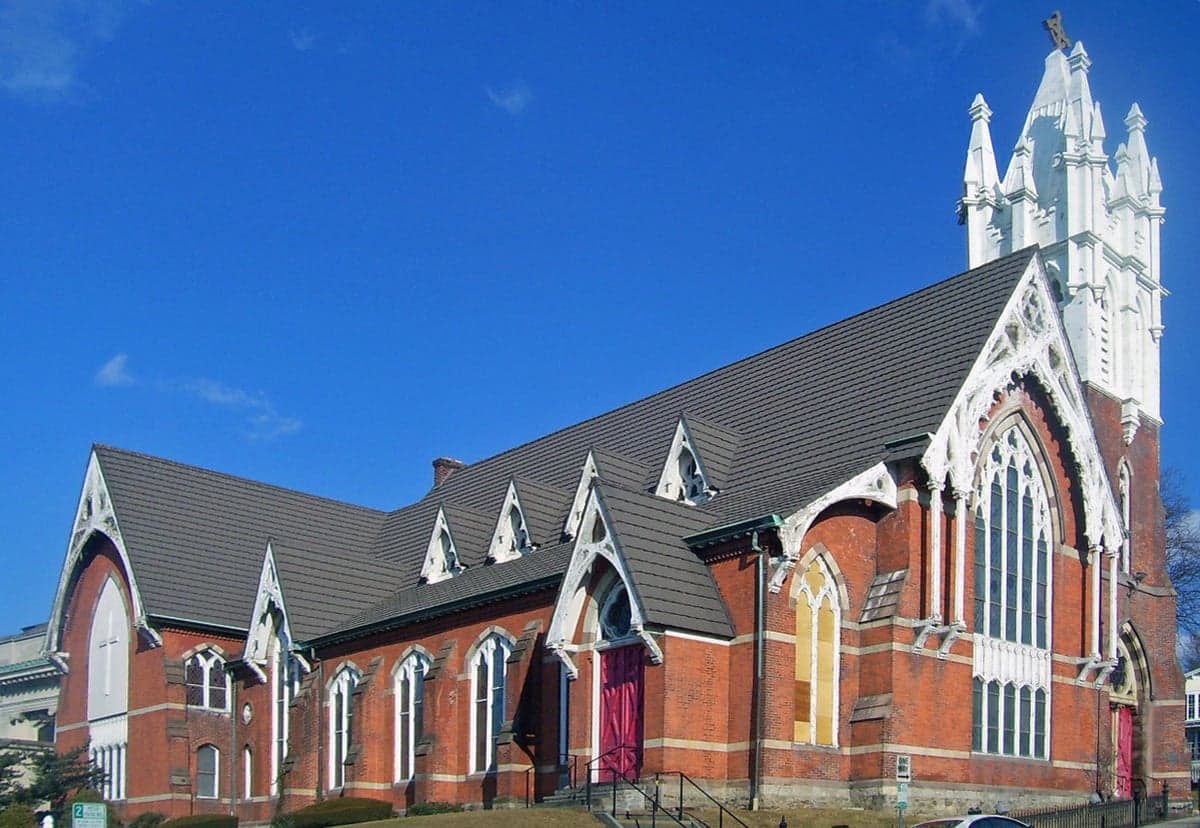

Photo: Wikipedia
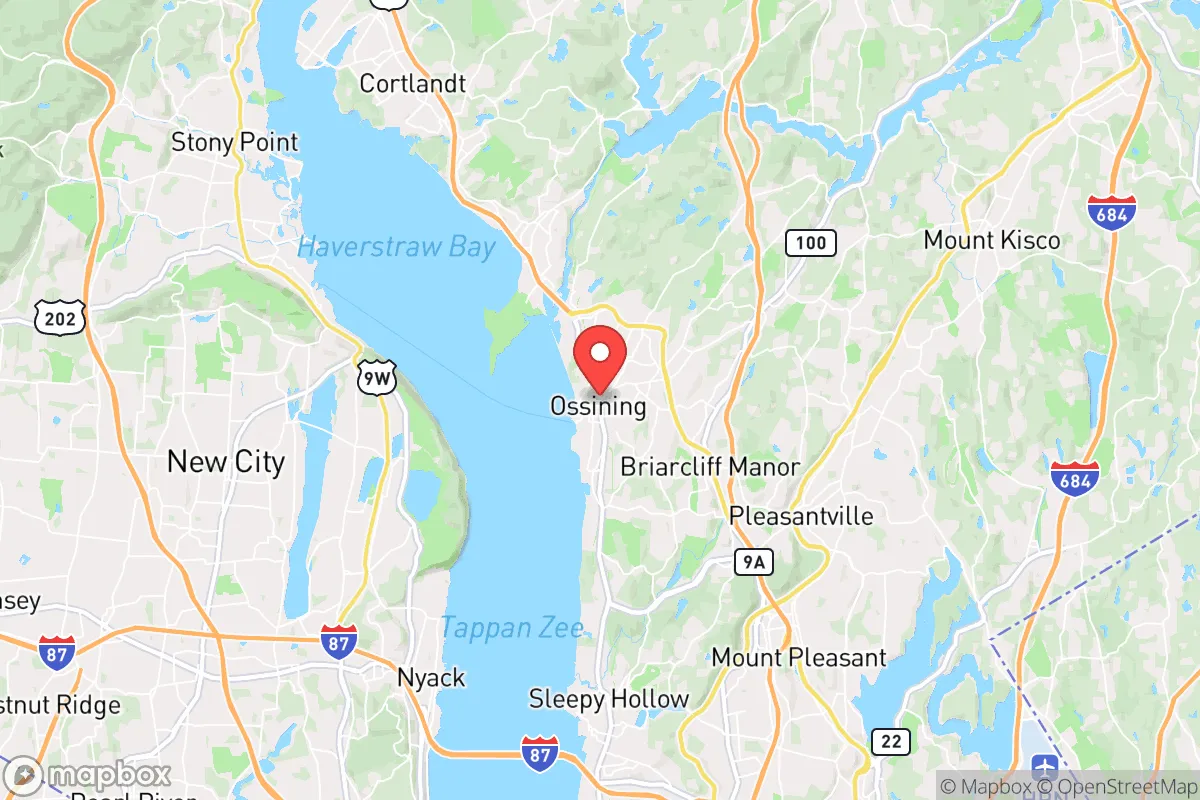
Demographics of Ossining, NY
Affluence Level in Ossining, NY
A middle-class area roughly in line with national averages across income, home values, education, and employment.
People of Ossining, NY
The people of Ossining, New York, today form a dense, majority-minority city of 26,979, defined by a near-even split between its 40.6% White and 41.7% Hispanic populations, with a significant 10.1% Black community and growing East/Southeast Asian (2.7%) and Indian (1.2%) enclaves. This is not a homogeneous suburb but a historically working-class Hudson River town where 15.9% of residents are foreign-born and 40.3% hold a college degree, creating a distinctive blend of old-guard families, immigrant strivers, and commuters to New York City. The city’s identity is shaped by its layered settlement history, visible in distinct neighborhoods that still reflect the waves of people who built them.
How the city was settled and grew
Ossining’s population story begins with the Sint Sinck Native Americans, from whom the area’s original name derived, but the first major European wave arrived in the late 17th and 18th centuries as Dutch and English farmers took up land grants along the Hudson River. The real transformation came in the 19th century with two forces: the opening of Sing Sing Prison in 1825 and the arrival of the Hudson River Railroad in 1849. The prison drew a workforce of guards, administrators, and laborers, while the railroad made Ossining a commuter suburb for New York City. Irish immigrants built the prison and railroad, settling in the Waterfront District along the river, where their descendants remain a visible part of the old Catholic parish life. Italian immigrants followed in the 1880s-1910s, working in the prison, local quarries, and as stonemasons; they concentrated in Highland Avenue and the Downtown area around Main Street, establishing social clubs and churches that still anchor the Italian-American community. A smaller wave of German and Eastern European Jewish families arrived in the early 1900s, settling in the Nelson Park and Downtown neighborhoods, contributing to Ossining’s small but historic Jewish presence. By 1950, Ossining was a predominantly White, working-to-middle-class town of about 16,000, with a clear ethnic patchwork of Irish, Italian, and Jewish enclaves.
Modern era (post-1965)
The 1965 Hart-Cellar Act and subsequent immigration waves reshaped Ossining dramatically. The most transformative shift began in the 1970s and 1980s, as Puerto Rican and later Dominican, Mexican, and Central American immigrants arrived, drawn by affordable housing and proximity to Westchester County’s service economy. They settled heavily in the Downtown area and along Spring Street, where Spanish-language storefronts, bodegas, and Pentecostal churches now dominate. By 2020, the Hispanic population had grown to 41.7%, making Ossining one of the most Latino municipalities in Westchester County. Concurrently, the Black population—historically small but present since the 19th century—grew through domestic migration from New York City and the South, concentrating in the Downtown and Waterfront District neighborhoods. The East/Southeast Asian community (2.7%) and Indian community (1.2%) are newer, arriving primarily since 2000, drawn by the school system and commuter rail; they are dispersed but have a visible presence in the Downtown and Nelson Park areas, with a handful of Asian grocery stores and Indian restaurants. The White population, once over 90%, has declined to 40.6%, though many long-standing Irish and Italian families remain in the Waterfront District and Highland Avenue areas, alongside newer White professionals attracted by the historic housing stock and river views.
The future
Ossining’s population is trending toward continued diversification, but not toward homogenization. The Hispanic share is likely to stabilize or grow slowly, as immigration from Latin America has plateaued nationally and second-generation families often move to more suburban parts of Westchester. The White population, while declining in share, is being replenished by younger professionals and families priced out of more expensive towns like Croton-on-Hudson and Sleepy Hollow. The East/Southeast Asian and Indian communities, though small, are growing steadily as Ossining’s school system and relatively affordable housing attract immigrant professionals. The city is not tribalizing into hostile enclaves—neighborhoods are increasingly mixed—but distinct cultural nodes persist: the Waterfront District remains the heart of the Irish-Italian old guard, Downtown is the Latino commercial and residential core, and Nelson Park is becoming a more diverse, professional-class area. Gentrification pressure is moderate, with new luxury apartments along the riverfront attracting higher-income residents, but the city’s stock of older, smaller homes and rent-stabilized units buffers rapid displacement.
For someone moving in now, Ossining is becoming a genuinely multi-ethnic, multi-class Hudson River town where no single group dominates. The old ethnic enclaves are softening, but the city retains a working-class, immigrant-inflected character that sets it apart from wealthier, whiter Westchester suburbs. The bottom line: Ossining offers a dense, walkable, transit-connected community with real diversity—but also the friction and vitality that come with it. It is not a place of quiet homogeneity, but of layered, ongoing demographic change.
* Values derived from national, state, county, city and local statistics and may differ in a specific area. Last updated: 2026-04-19T03:29:03.000Z
Narrative content on this page is AI-generated and may contain mistakes. Verify any details that matter before acting on them.
ReloMaps may earn a commission from affiliate links at no extra cost to you.