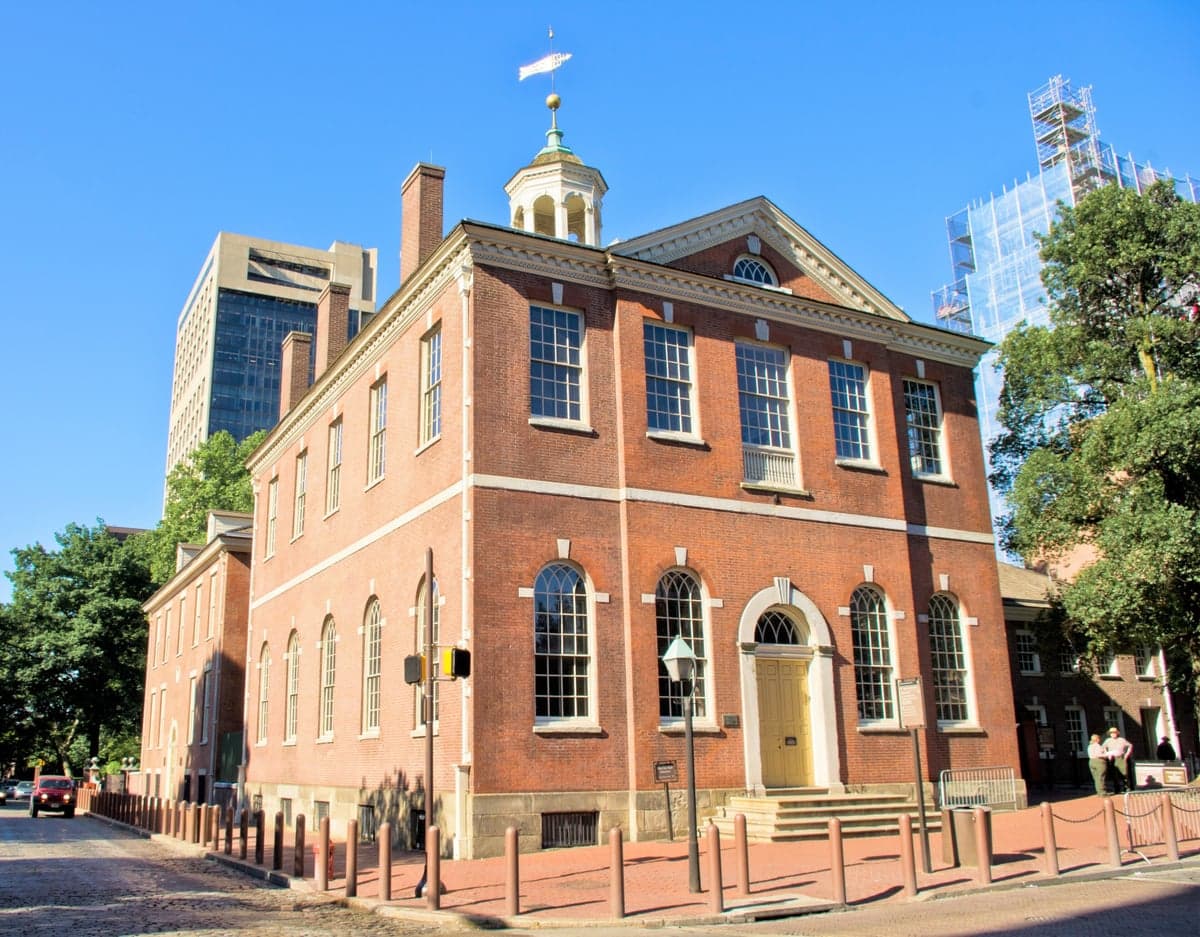
Photo: Wikipedia
Demographics of Philadelphia County
Affluence Level in Philadelphia County
A below-average socioeconomic profile. Incomes, home values, and educational attainment trail the U.S., with higher poverty and unemployment.
People of Philadelphia County
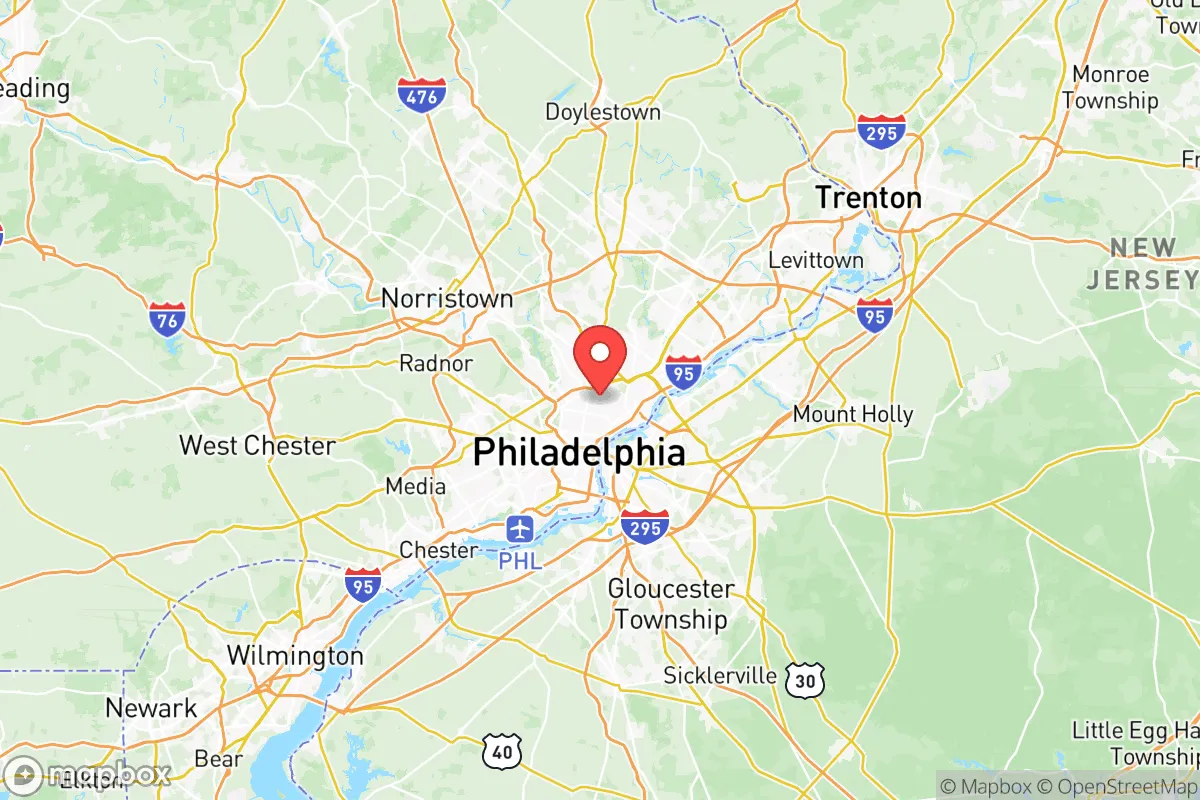
Philadelphia County is the nation’s most densely populated major county, home to over 1.58 million people within just 143 square miles. Its population is a striking mosaic: 38.9% Black, 33.6% White, 15.2% Hispanic, 5.8% East and Southeast Asian, and 1.9% Indian, with 34.6% holding a college degree. The county is synonymous with the city of Philadelphia itself, a place where deep-rooted working-class identity coexists with a growing professional class, and where historic ethnic neighborhoods still define the street grid.
Settlement & growth (pre-1960)
Before European contact, the land now called Philadelphia County was home to the Lenape people, who lived in seasonal villages along the Delaware and Schuylkill rivers. The Lenape called the area "Shackamaxon," a site near present-day Kensington and Fishtown where William Penn’s 1682 treaty with the tribe is commemorated. Penn’s "Holy Experiment" attracted a flood of English Quakers, who founded the city of Philadelphia in 1682 and laid out a grid of streets between the Delaware and Schuylkill rivers. The Quakers’ religious tolerance drew a diverse early population: Germans settled in the Northern Liberties and Germantown (founded 1683), while Scots-Irish Presbyterians clustered in the city’s western fringe, around what is now University City.
By the mid-19th century, Philadelphia had become America’s industrial powerhouse, and its population exploded. The Consolidation Act of 1854 merged Philadelphia County’s dozens of townships and boroughs into a single city-county, absorbing places like Manayunk, Roxborough, and Frankford. Irish immigrants fleeing the Great Famine (1845–1852) packed into shantytowns in the river wards—Kensington, Fishtown, and Grays Ferry—working in textile mills, shipyards, and the Pennsylvania Railroad yards. Germans continued arriving, settling in the brewing and manufacturing districts of North Philadelphia, particularly around Girard Avenue and the neighborhoods of Olde Kensington and Yorktown.
The late 19th and early 20th centuries brought Southern and Eastern Europeans. Italians concentrated in South Philadelphia, especially around the Italian Market on 9th Street, and in the working-class rowhouses of Bella Vista and Passyunk Square. Polish immigrants built St. John Cantius Church in the Port Richmond neighborhood and established a strong community in Bridesburg along the Delaware River. Russian and Eastern European Jews settled along South Street and in the Strawberry Mansion and Logan sections of North Philadelphia. By 1910, Philadelphia was one of the world’s most ethnically diverse cities, with foreign-born residents making up over a quarter of the population.
The Great Migration (1915–1970) transformed Philadelphia’s racial makeup. Black Americans from the rural South—especially Virginia, the Carolinas, and Georgia—arrived by the tens of thousands, seeking industrial jobs in the city’s steel mills, shipyards, and factories. They settled initially in the Seventh Ward (documented by W.E.B. Du Bois in The Philadelphia Negro), then spread to North Philadelphia, Point Breeze, and West Philadelphia. By 1960, Philadelphia’s Black population had grown to 26% of the county total, concentrated in neighborhoods like Strawberry Mansion, Mantua, and Germantown.
Modern era (post-1965)
The 1965 Hart-Cellar Act opened immigration from Asia, Latin America, and the Caribbean, reshaping Philadelphia County’s ethnic landscape. The most visible new wave has been Puerto Rican and Dominican migration, which began in the 1950s but accelerated after 1965. The Hispanic population, now 15.2% of the county, is centered in North Philadelphia’s Fairhill and Hunting Park neighborhoods—often called "El Centro de Oro"—and in the lower Northeast sections of Kensington and Harrowgate. Mexican and Central American immigrants have also arrived since the 1990s, settling in South Philadelphia and the Olney-Oak Lane corridor.
East and Southeast Asian communities (5.8% of the county) have grown steadily. Philadelphia’s Chinatown, founded in the 1870s but revitalized after 1965, remains the cultural hub for Chinese immigrants, located just north of Center City. Vietnamese refugees arrived after 1975, establishing a commercial strip on Washington Avenue in South Philadelphia and a residential cluster in the Whitman neighborhood. Korean immigrants concentrate in the Olney and Logan sections, where a dense corridor of Korean-owned businesses lines North 5th Street. The Indian community (1.9% of the county) is more dispersed, with significant clusters in the University City area near the University of Pennsylvania and in the Northeast Philadelphia neighborhoods of Somerton and Bustleton.
Domestic migration has been a countervailing force. From 1950 to 2000, Philadelphia County lost over 500,000 residents to suburban flight—primarily white families moving to Bucks, Montgomery, and Delaware counties. This exodus hollowed out many rowhouse neighborhoods, leaving blocks of vacant homes in North and West Philadelphia. Since 2000, the trend has partially reversed: young professionals and empty-nesters have repopulated Center City, Northern Liberties, Fishtown, and Graduate Hospital, driving a 4.6% population increase from 2010 to 2020. However, this gentrification has displaced many long-term Black and Hispanic residents to the lower Northeast and the inner-ring suburbs.
The future
Philadelphia County is becoming more diverse and more educated, but also more economically polarized. The white population, now 33.6%, is aging and concentrated in Center City and the gentrifying river wards, while the Black population (38.9%) is declining slightly as families move to suburbs like Cheltenham and Upper Darby. The Hispanic share is rising steadily, driven by both immigration and higher birth rates, and is projected to reach 20% by 2040. East and Southeast Asian and Indian populations are growing rapidly, particularly in Northeast Philadelphia and University City, as the city’s tech and healthcare sectors expand.
The county’s cultural identity is evolving from a Black-white binary to a multiethnic, multilingual metropolis. New immigrant enclaves are forming in the lower Northeast—around Castor Avenue and Cottman Avenue—where Vietnamese, Korean, and Mexican businesses now line former Jewish and Irish commercial strips. The city’s public schools, long a driver of suburban flight, are seeing stabilization in some catchment areas as young families choose to stay. However, the county still faces deep challenges: a poverty rate above 20%, a shrinking middle class, and a housing stock that is both aging and increasingly unaffordable in desirable neighborhoods.
For someone moving to Philadelphia County now, the region offers a dense, walkable urban experience with a rich historical fabric and a genuinely diverse population. The city is becoming more Asian and Hispanic, more college-educated, and more economically stratified. The neighborhoods that will thrive are those that can balance new investment with the preservation of the working-class and immigrant communities that have always defined Philadelphia’s character.

* Values derived from national, state, county, city and local statistics and may differ in a specific area. Last updated: 2026-08-08T13:14:41.000Z
Narrative content on this page is AI-generated and may contain mistakes. Verify any details that matter before acting on them.
ReloMaps may earn a commission from affiliate links at no extra cost to you.

