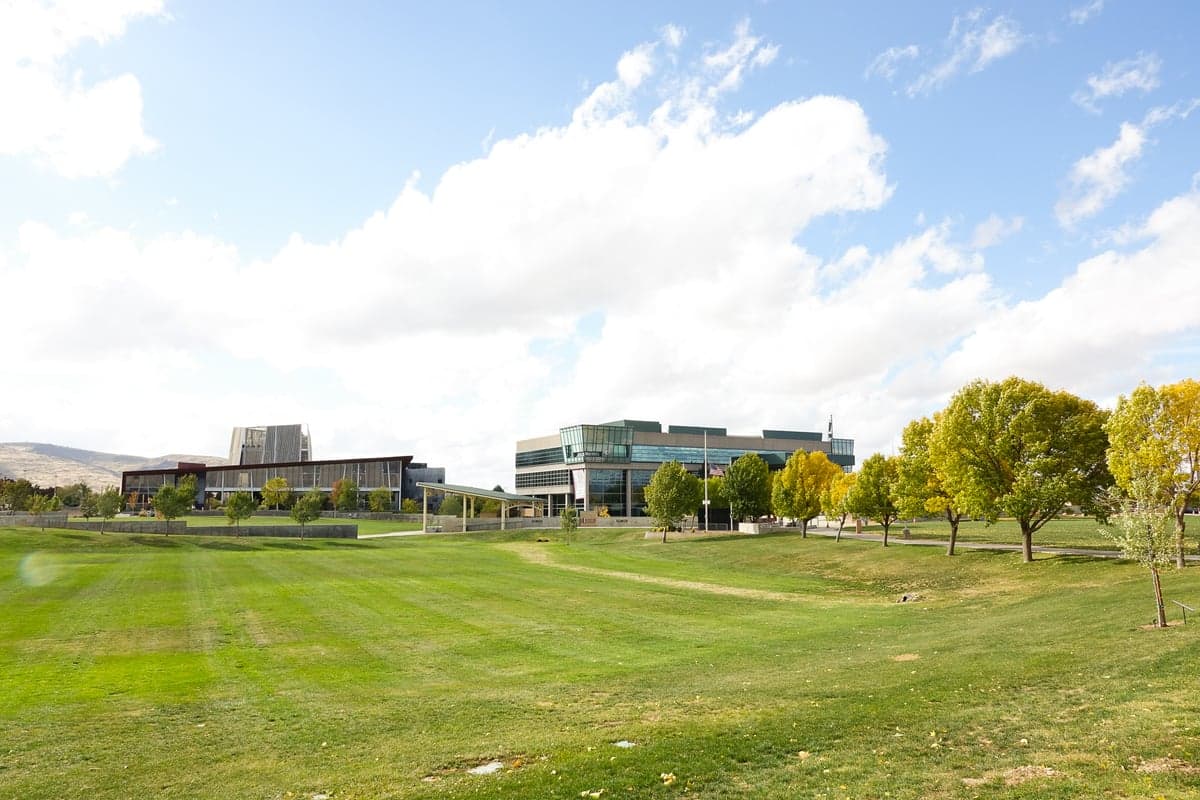
Photo: Wikipedia
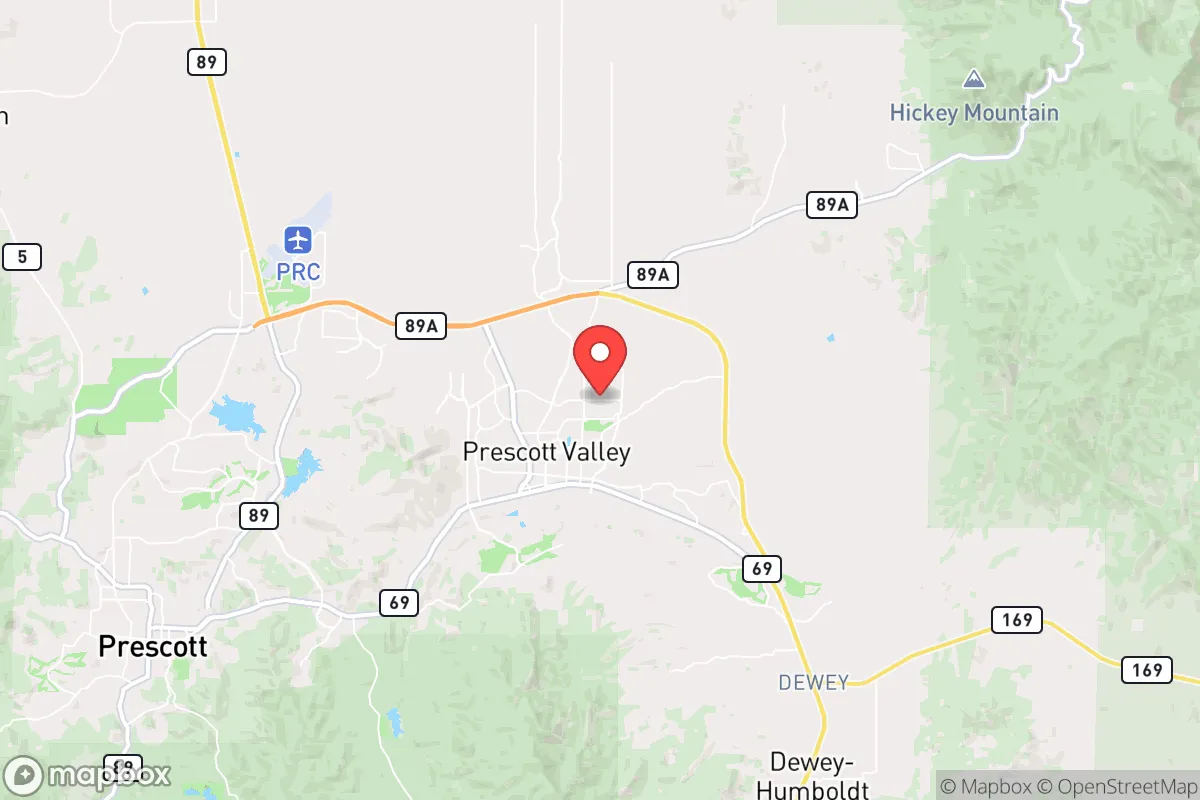
Demographics of Prescott Valley, AZ
Affluence Level in Prescott Valley, AZ
A middle-class area roughly in line with national averages across income, home values, education, and employment.
People of Prescott Valley, AZ
Prescott Valley, Arizona, is a predominantly white, family-oriented community of 48,048 residents where 73.2% of the population identifies as white alone and 19.9% as Hispanic. The city is notably less diverse than the national average, with a foreign-born population of just 4.0% and minimal representation from Black (0.4%), East/Southeast Asian (1.1%), and Indian subcontinent (0.0%) communities. This demographic profile reflects a city built primarily by domestic migrants from the Midwest and Southwest, drawn by affordable land, a mild climate, and a conservative, self-reliant ethos that continues to define the area today.
How the city was settled and grew
Prescott Valley has no pioneer or colonial history; it is a genuine post-1950s Sun Belt suburb. The area was originally part of the sprawling Chino Valley ranching district, used for cattle grazing by a handful of families. The modern city began in the 1960s when developers purchased the 7,000-acre Lonesome Valley Ranch and began platting the Prescott Valley Estates subdivision, the city's first master-planned neighborhood. The original wave of settlers were mostly white, middle-class families from California and the Midwest, fleeing urban crowding and seeking cheaper land. Many were retirees or veterans; the nearby Prescott VA Medical Center and the steady expansion of Yavapai College drew a second wave of service-sector and education workers. The Granville neighborhood, built in the 1970s, became the primary landing area for these early families, with its ranch-style homes on large lots. By 1980, the population had reached roughly 2,000, almost entirely white and native-born.
Modern era (post-1965)
Prescott Valley's major growth spurt came after 1990, driven by the completion of State Route 69 and the expansion of the Prescott Regional Airport. The city's population surged from 8,000 in 1990 to over 48,000 today. This wave was overwhelmingly domestic: retirees from the Rust Belt, telecommuters from Phoenix and Los Angeles, and younger families seeking affordable housing. The Hispanic population grew from roughly 5% in 1990 to 19.9% today, concentrated in the Mountain View Park and Sunset Hills neighborhoods, where many work in construction, landscaping, and hospitality. The East/Southeast Asian community (1.1%) is small and dispersed, with no distinct ethnic enclave; most are professionals in healthcare or tech who live in the newer Prescott Valley Heights subdivision. The Black population (0.4%) and Indian subcontinent population (0.0%) remain negligible. The city's college-educated share (24.0%) is below the national average, reflecting a workforce tilted toward trades, retail, and healthcare rather than white-collar professions.
The future
Prescott Valley is likely to continue homogenizing rather than diversifying. The Hispanic share is growing slowly (up from 15% in 2010 to 19.9% in 2024), but this growth is concentrated in lower-cost neighborhoods like Mountain View Park and is driven by natural increase rather than new immigration. The foreign-born share (4.0%) is well below the Arizona average of 13.6%, and there is no sign of a significant new immigrant wave. The white population, while declining slightly as a share, remains dominant and is aging in place; the median age is 44. The city's zoning policies favor large-lot single-family homes, which discourages the apartment construction that often attracts younger, more diverse populations. Over the next decade, expect Prescott Valley to remain a predominantly white, middle-class, conservative suburb, with a growing but assimilated Hispanic minority and virtually no growth in Black, Asian, or Indian communities. The city is not tribalizing into distinct ethnic enclaves; rather, it is slowly becoming slightly more Hispanic while staying overwhelmingly native-born and English-dominant.
For a conservative-leaning mover, Prescott Valley offers a stable, low-crime, family-oriented environment where the population is largely like-minded and the demographic changes are gradual rather than disruptive. The city is not becoming a diverse melting pot; it is becoming a slightly more Hispanic version of its current self, with the same core values of self-reliance, outdoor recreation, and small-town community. New arrivals will find a place where neighbors know each other, schools are functional, and the pace of life remains deliberately slow.
* Values derived from national, state, county, city and local statistics and may differ in a specific area. Last updated: 2026-04-19T20:21:16.000Z
Narrative content on this page is AI-generated and may contain mistakes. Verify any details that matter before acting on them.
ReloMaps may earn a commission from affiliate links at no extra cost to you.