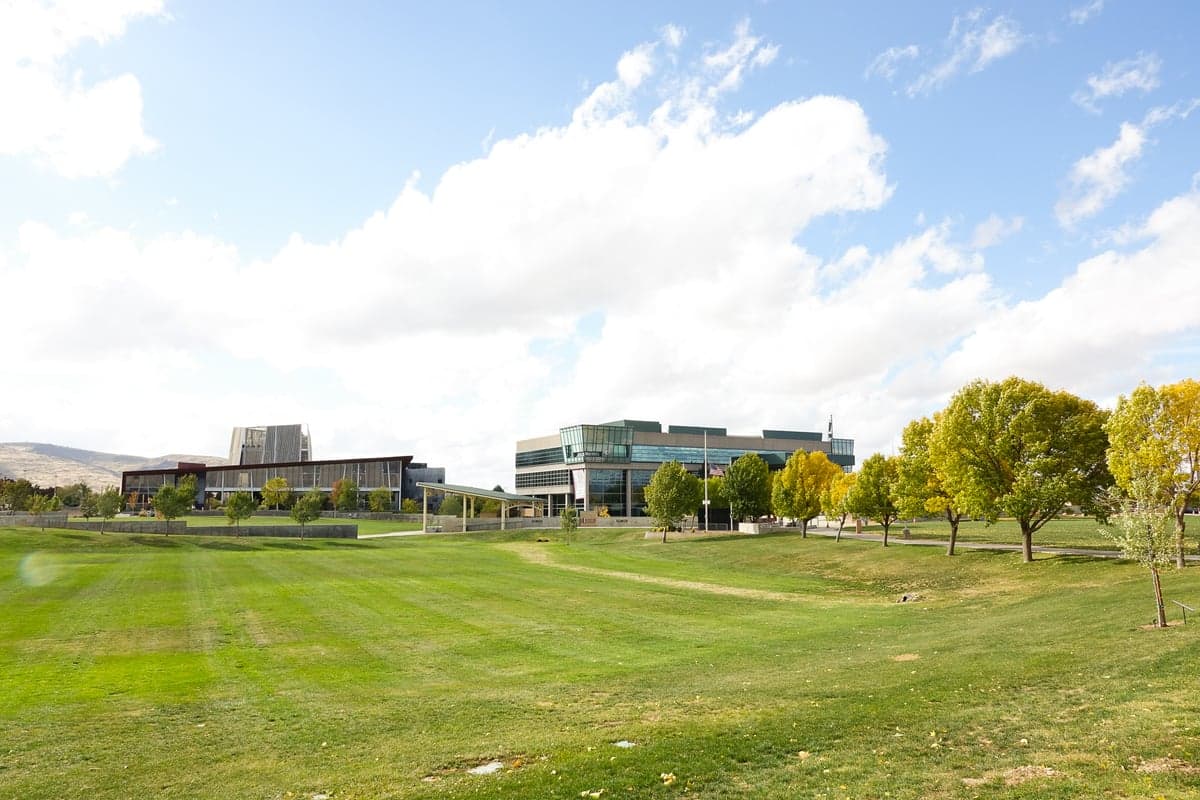
Photo: Wikipedia
Quality of Life in Prescott Valley, AZ
A high quality of life with strong walkability, manageable living costs, healthy neighborhood signals, and solid amenity access.
What does Quality of Life tell us?
Quality of Life blends cost of living, nearby amenities, socioeconomic signals, and neighborhood character. City-level scores represent the whole municipality; individual neighborhoods can differ.
What does this tell us?
Quality of Life blends cost of living, nearby amenities, socioeconomic signals, and neighborhood character. City-level scores represent the whole municipality; individual neighborhoods can differ.
Cost of Living
29% above national average
The Real Cost of Living in Prescott Valley, AZ for 2026
| Tier | Individual | Family (4) |
|---|---|---|
| Survival | $23k | $44k |
| Comfortable | $69k | $102k |
| Luxury | $101k+ | $157k+ |
| Elite (Top 5%) | $119k+ | $185k+ |
70%
The Area Signal
A metric tracking the socioeconomic signals of the area.


Hobbies
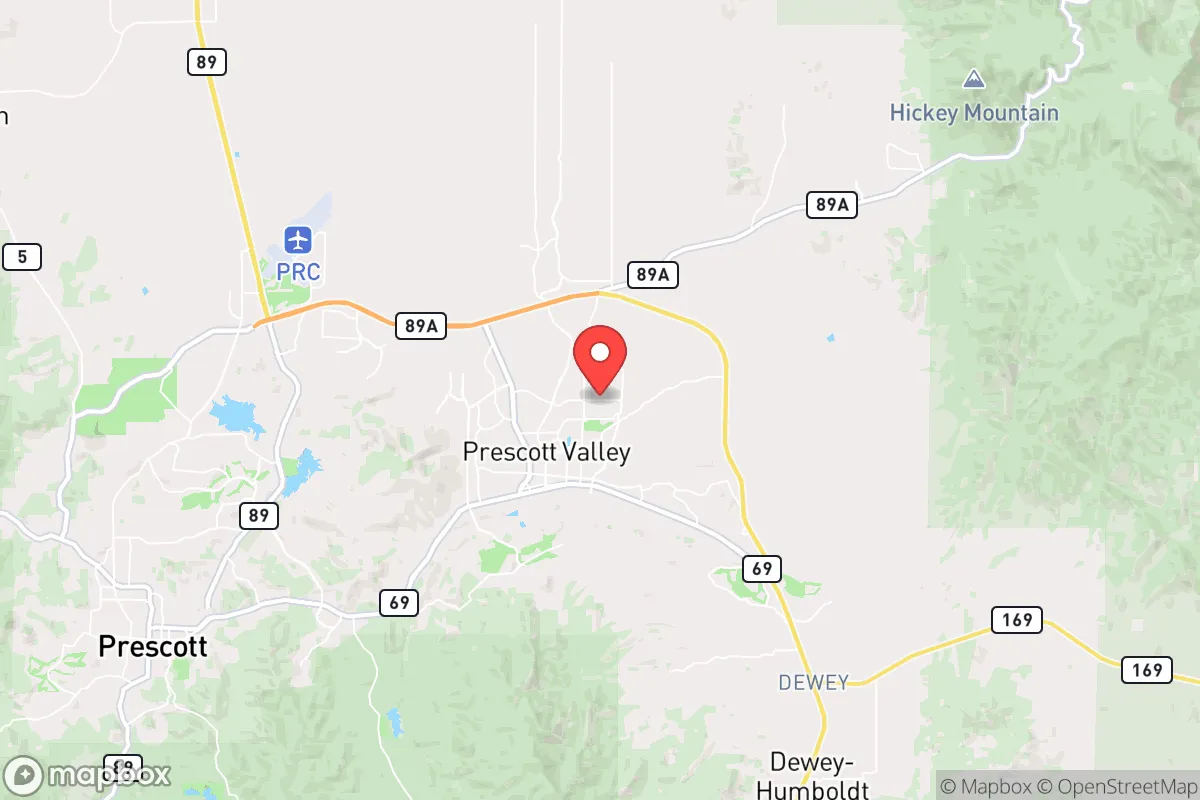
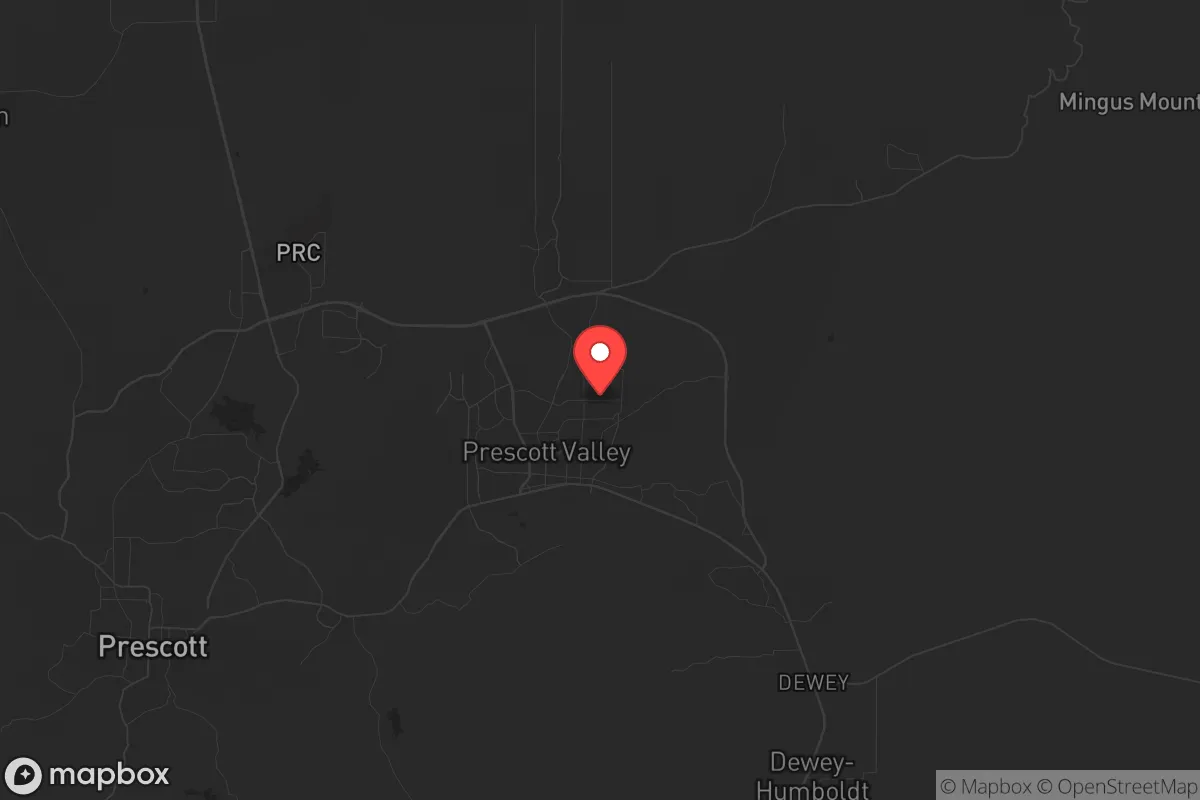
Explore the areaGroceries
3 within 10 miles
Gas
0 within 10 miles
Hospital
3 within 20 miles
Airport
PHX — Phoenix Sky Harbor International
Post Office
USPS — Prescott, AZ
Critical Amenities
Quality-of-Life Analysis
Prescott Valley, Arizona, presents a middle-to-upper-middle-class quality of life shaped by its position as a more affordable alternative to neighboring Prescott, with a cost of living index of 129 (29% above the U.S. average). The town attracts a blend of retirees seeking a lower-tax, warmer-climate lifestyle, remote workers drawn by the high-desert scenery, and families priced out of the Flagstaff or Scottsdale markets. Its population skews older and more politically conservative than the national average, with a median age around 44 and a strong presence of veterans and outdoor enthusiasts.
How Prescott Valley's cost of living and housing compare to Prescott and Flagstaff
Prescott Valley’s cost of living is significantly lower than its more famous neighbor Prescott, where the index often exceeds 140. The median home value of $376,300 is roughly $100,000 less than the median in Prescott proper, making it the most attainable homeownership option in the Quad Cities area. Median rent sits at $1,471, which is about 15% below the Prescott average and nearly 30% below Flagstaff’s rental market. However, the index of 129 still means everyday expenses—groceries, utilities, and healthcare—run about 29% higher than the national norm, driven by the region’s reliance on imported goods and limited retail competition. The average commute of 21.5 minutes is notably shorter than the national average of 26 minutes, reflecting the town’s compact layout and the fact that many residents work locally in retail, healthcare, or construction rather than commuting to Prescott or Phoenix.
What daily life is like for families and retirees: amenities, schools, and recreation
Daily life in Prescott Valley revolves around a mix of big-box retail (the Prescott Gateway Mall and the new Costco-anchored shopping center), chain restaurants, and outdoor access. The town’s school system, Humboldt Unified School District, includes Bradshaw Mountain High School, which has a graduation rate around 85% and offers dual-enrollment programs with Yavapai College. For retirees, the Prescott Valley Recreation Center provides a 50,000-square-foot fitness facility, pickleball courts, and senior programming, while the nearby Fain Park offers 5 miles of hiking trails and a fishing lake. Healthcare is anchored by the Dignity Health - Prescott Valley Medical Center, a 24-bed emergency and outpatient facility, though serious cases require a 15-minute drive to Prescott’s Yavapai Regional Medical Center. The town lacks a vibrant downtown or nightlife—most social life happens at coffee shops, the library, or community events like the annual Prescott Valley Days festival. Internet access is solid, with fiber-optic service from TDS and Spectrum covering most neighborhoods, supporting the remote-worker population.
Prescott Valley is best suited for those who prioritize affordability, low crime rates (the property crime rate is about 30% below the Arizona average), and year-round outdoor recreation over urban amenities or cultural density. Retirees on fixed incomes will appreciate the lack of state income tax on Social Security benefits and the lower housing costs compared to Prescott. Families should weigh the trade-off of a modest school district against the short commute and access to hiking, mountain biking, and nearby Watson Lake. Remote workers and tradespeople will find the balance of cost, climate, and connectivity compelling, while those seeking walkable neighborhoods, nightlife, or top-tier public schools should look to Prescott or Flagstaff instead.
Crime in Prescott Valley, AZ
Lower crime rates than 80% of comparable U.S. locations.
Violent CrimeViolent Crime Analysis
Property CrimeProperty Crime Analysis
Crime Analysis
Prescott Valley, Arizona, presents a mixed safety profile that requires careful consideration. The town's violent crime rate of 300.3 incidents per 100,000 residents and property crime rate of 682.2 per 100,000 place it in a middle tier nationally, but the surrounding Yavapai County's proximity to the Phoenix metro area introduces dynamics that can affect local safety. As a growing community within a large metropolitan sphere of influence, Prescott Valley faces challenges common to areas where progressive justice policies in nearby urban centers may contribute to regional crime patterns.
Crime in context
Prescott Valley's violent crime rate of 300.3 per 100,000 is notably lower than the national average of approximately 380 per 100,000, but it exceeds the Arizona state average of roughly 270 per 100,000. Property crime, at 682.2 per 100,000, sits below the national benchmark of about 1,950 per 100,000 but remains a concern for residents. These figures reflect a community that is safer than many comparable Sun Belt towns, yet the influence of larger metro-area justice systems—particularly those in Maricopa County and Phoenix—can create a "spillover" effect. Progressive district attorneys and judges in those jurisdictions, who often prioritize diversion and reduced sentencing, may release offenders who then target smaller communities like Prescott Valley, where policing resources are thinner.
What residents experience
Daily life in Prescott Valley involves typical suburban precautions. Property crimes such as vehicle break-ins and theft from unsecured sheds are the most common incidents residents report, often concentrated near commercial corridors like Highway 69 and the Prescott Gateway Mall area. Violent crime is less frequent but does occur, with aggravated assault and robbery being the primary categories. The town's police department maintains a visible presence, but the broader regional context is critical: progressive criminal justice reforms in Phoenix and Tucson have been linked to increased recidivism and offender mobility, meaning a criminal arrested in Prescott Valley may face lenient treatment if their case falls under a more liberal jurisdiction's purview. This creates a system where public safety is undermined by policies that prioritize offender rehabilitation over victim protection.
Neighborhood-level variation in Prescott Valley is moderate. Older subdivisions near the town center tend to report slightly higher property crime rates, while newer master-planned communities on the outskirts, such as those near the Prescott Valley Sports Complex, generally see fewer incidents. Gated communities and homes with active neighborhood watch programs offer additional security. However, the overarching concern remains the regional justice environment: residents should be aware that the lenient policies of nearby metro-area prosecutors can directly impact local safety, as offenders who would otherwise be incarcerated are returned to the streets, potentially targeting Prescott Valley's residential areas. For those prioritizing safety, choosing a home in a well-established HOA with private security and staying informed about local judicial elections are practical steps.
* Values derived from national, state, county, city and local statistics and may differ in a specific area. Last updated: 2026-04-19T20:21:16.000Z
Narrative content on this page is AI-generated and may contain mistakes. Verify any details that matter before acting on them.
ReloMaps may earn a commission from affiliate links at no extra cost to you.