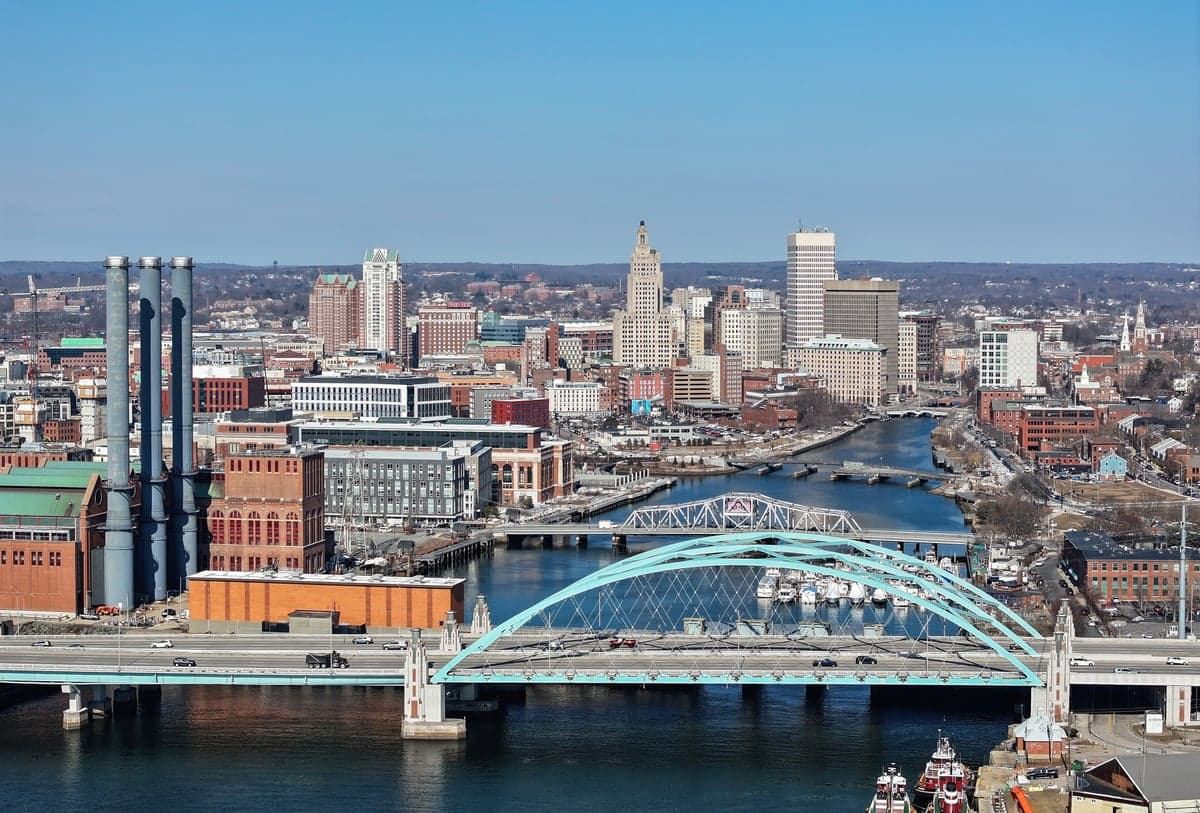
Photo: Wikipedia
Quality of Life in Providence, RI
A high quality of life with strong walkability, manageable living costs, healthy neighborhood signals, and solid amenity access.
What does Quality of Life tell us?
Quality of Life blends cost of living, nearby amenities, socioeconomic signals, and neighborhood character. City-level scores represent the whole municipality; individual neighborhoods can differ.
What does this tell us?
Quality of Life blends cost of living, nearby amenities, socioeconomic signals, and neighborhood character. City-level scores represent the whole municipality; individual neighborhoods can differ.
Cost of Living
15% above national average
The Real Cost of Living in Providence, RI for 2026
| Tier | Individual | Family (4) |
|---|---|---|
| Survival | $21k | $40k |
| Comfortable | $63k | $92k |
| Luxury | $121k+ | $187k+ |
| Elite (Top 5%) | $163k+ | $252k+ |
72%
The Area Signal
A metric tracking the socioeconomic signals of the area.
Hobbies
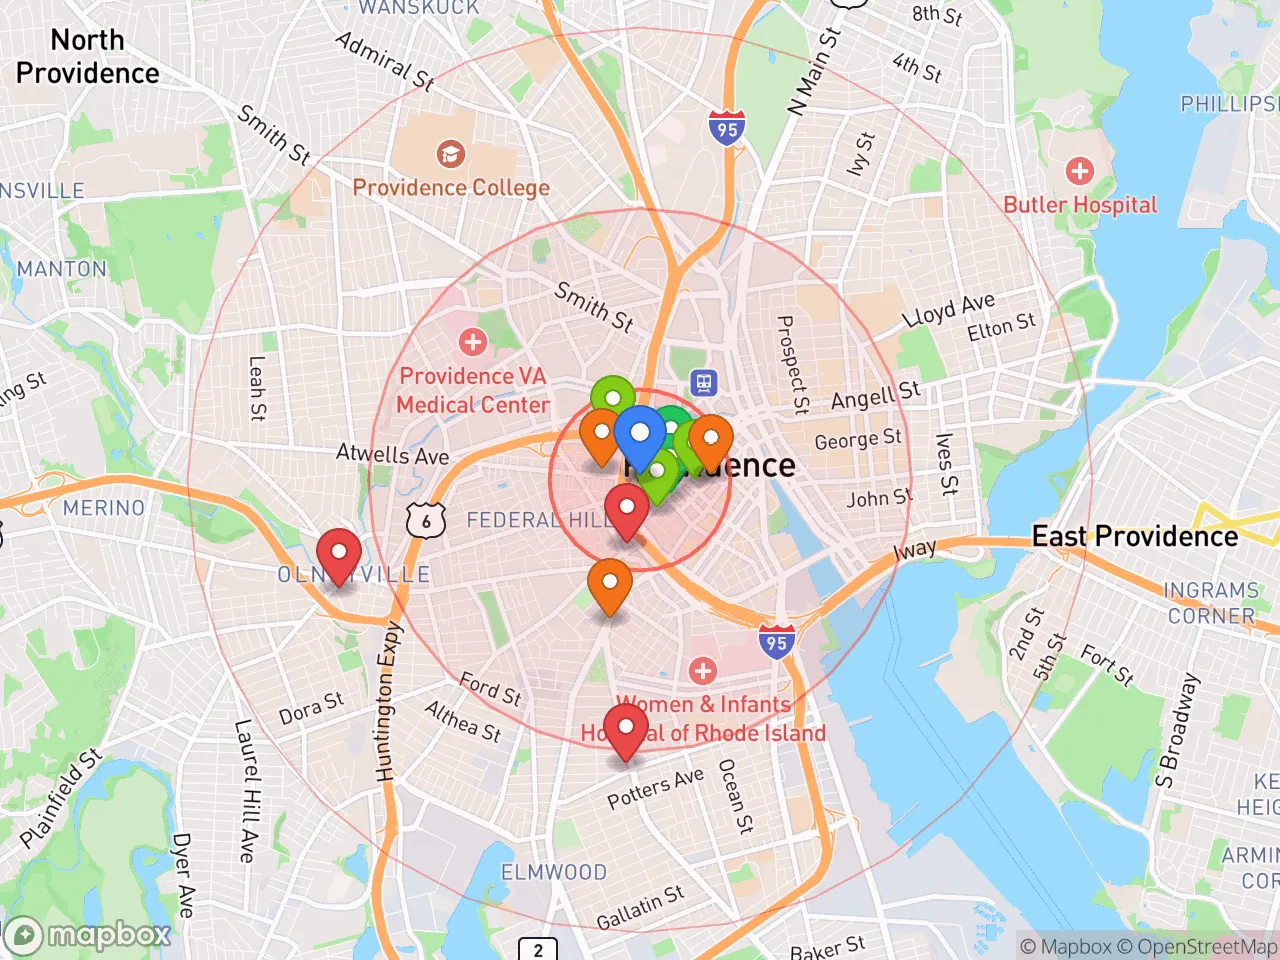
Explore the areaGroceries
6 within 10 miles
Gas
20 within 10 miles
Hospital
20 within 20 miles
Airport
PDX — Portland International Jetport
Post Office
USPS — Providence, RI
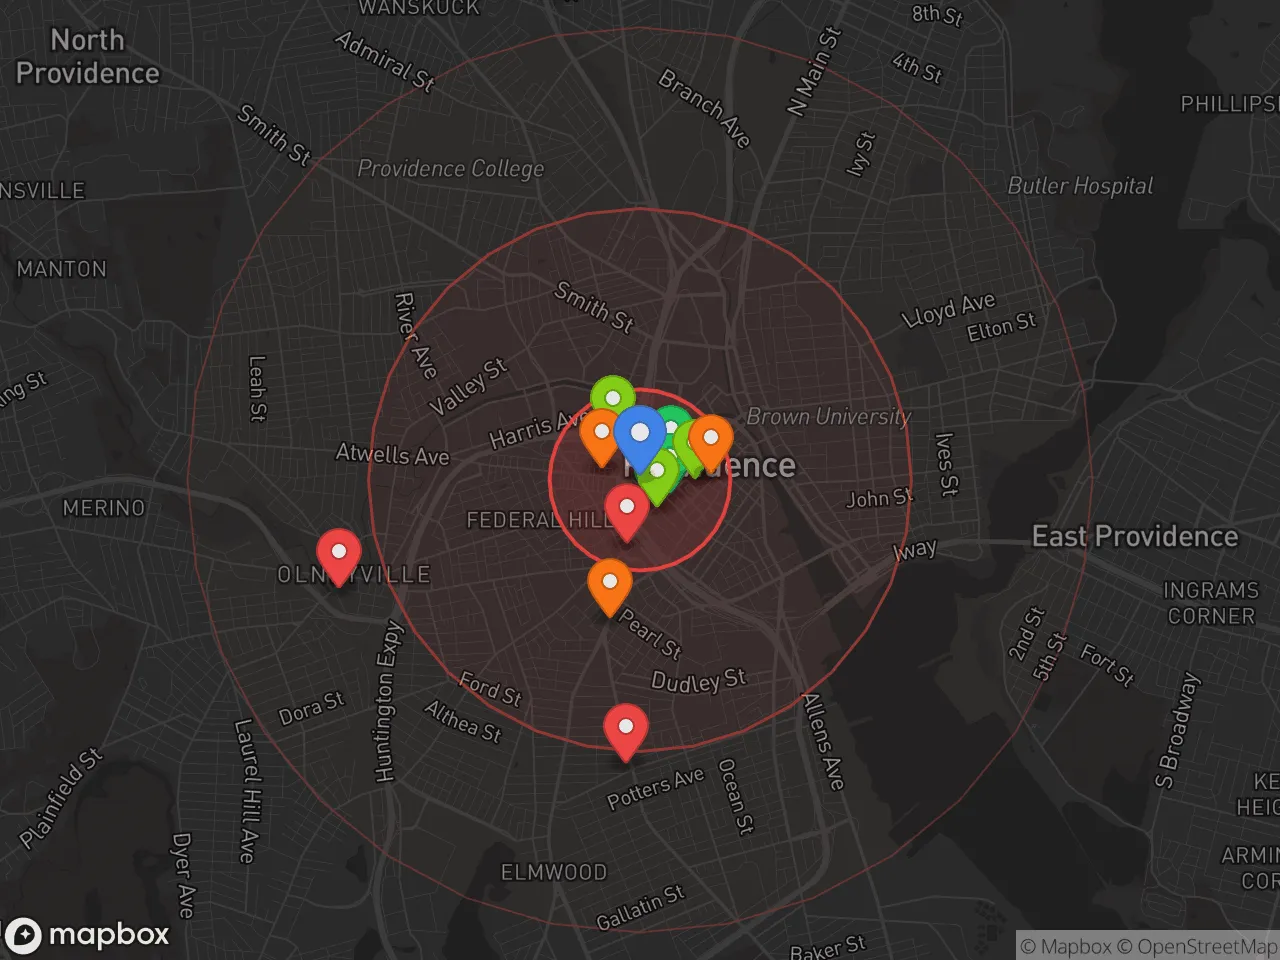
Critical Amenities
Quality-of-Life Analysis
Providence, Rhode Island, presents a distinctive quality-of-life profile that blends urban energy with a more moderate cost structure than its Boston neighbor, attracting a mix of students, young professionals, and long-term residents. With a cost-of-living index of 115 (where 100 equals the U.S. average), the city is notably more affordable than the Boston metro area (index ~150) while still offering dense, walkable neighborhoods and a robust cultural scene. The population skews younger and more transient than the state average, driven by institutions like Brown University, Rhode Island School of Design, and Johnson & Wales University, which together infuse the city with a creative, academic character.
How housing costs and affordability compare to Boston and other Northeast cities
Providence’s housing market is a key draw for those priced out of Boston but seeking urban amenities. The median home value sits at $322,800, roughly one-third of Boston’s median, while the median rent of $1,333 is about half of what comparable apartments cost in Cambridge or Back Bay. This affordability gap has fueled a steady influx of remote workers and commuters, though it also means Providence’s housing stock—much of it pre-war triple-deckers and Victorian-era homes—can be older and less energy-efficient than suburban alternatives. The average commute of 25 minutes is notably shorter than the Boston metro average of 32 minutes, a practical advantage for residents who work locally or take the MBTA commuter rail (about 1 hour to South Station). However, property taxes in Providence are relatively high (roughly $15–$18 per $1,000 of assessed value), which can offset some of the home-price savings for buyers.
What daily life is like for families, students, and professionals
Daily life in Providence revolves around its compact, walkable neighborhoods—Federal Hill for Italian dining, the East Side for historic homes and college-town energy, and Downcity for arts and nightlife. The city’s public school system, Providence Public Schools, has faced chronic underfunding and low test scores, leading many families to consider charter schools (e.g., Achievement First) or private options like Moses Brown School. For higher education, the city is a powerhouse: Brown University and RISD anchor a vibrant intellectual scene, while Johnson & Wales draws culinary and hospitality students. Amenities include the Providence Place Mall, WaterFire (a seasonal art installation on the rivers), and the Roger Williams Park Zoo. The city’s food scene is nationally recognized, with a strong emphasis on Italian, Portuguese, and Cape Verdean cuisines. Transit is served by RIPTA buses and the Providence/Stoughton Line of the MBTA, though car ownership remains common for errands and suburban access.
Providence is best suited for individuals and families who value walkable urbanism, cultural density, and lower housing costs than Boston, but who can tolerate older infrastructure, variable public school quality, and a smaller job market. Creative professionals, academics, and remote workers will find the most alignment with the city’s rhythm, as will those who enjoy a four-season climate with distinct winters. For families prioritizing top-tier public schools or large suburban yards, nearby suburbs like Barrington or East Greenwich may be a better fit. Ultimately, Providence offers a rare combination of urban character and relative affordability in the Northeast, making it a compelling choice for those who prioritize place over square footage.
Crime in Providence, RI
Generally safer than 60% of comparable U.S. locations.
Violent CrimeViolent Crime Analysis
Property CrimeProperty Crime Analysis
Crime Analysis
Providence, Rhode Island, presents a mixed safety picture for potential residents. While the city's violent crime rate of 140.1 per 100,000 residents is notably lower than many comparable Northeast urban centers, its property crime rate of 879.5 per 100,000 is significantly elevated, placing it above both state and national averages. This combination means that while violent confrontations are less common, the risk of theft, burglary, and vehicle break-ins is a tangible daily concern for most residents.
Crime in context
Providence's violent crime rate of 140.1 per 100,000 is roughly 40% lower than the national average for cities of its size, a statistic that often surprises newcomers. However, the property crime rate of 879.5 per 100,000 is approximately 30% higher than the national average, placing the city in a higher-risk tier for non-violent offenses. A critical factor driving these property crime numbers is the broader legal environment in Rhode Island. The state's progressive judiciary and district attorneys, while focused on rehabilitation and reducing incarceration, have created a system where repeat property offenders frequently cycle through the courts with minimal consequences. This "catch-and-release" dynamic, particularly for low-level theft and drug-related property crime, directly contributes to the elevated rates, as offenders face little deterrent for reoffending. Residents should be aware that this ideological approach to justice, while well-intentioned, often prioritizes offender outcomes over public safety and victim restitution.
What residents experience
For those living in Providence, the most common safety issues are property-related. Car break-ins, package theft from porches, and bicycle theft are pervasive, especially in densely populated neighborhoods like the East Side, Federal Hill, and Downcity. Violent crime, while less frequent, is highly concentrated in specific areas, often tied to gang activity or domestic disputes. The Providence Police Department has implemented community policing initiatives and ShotSpotter gunshot detection technology, but response times can vary significantly by neighborhood. Many residents rely on personal security measures—motion-sensor lights, security cameras, and neighborhood watch groups—as a practical necessity. The progressive legal climate means that even when arrests are made for property crimes, suspects are often released on personal recognizance or with minimal bail, a pattern that erodes public confidence in the justice system and leaves victims feeling unheard.
Neighborhood-level variation is stark. The East Side (including College Hill and Wayland Square) generally sees the lowest crime rates, benefiting from the presence of Brown University and higher property values. Conversely, areas like Olneyville, South Providence, and parts of Elmwood experience the highest concentrations of both violent and property crime. The West End and Federal Hill fall in a middle tier, with moderate property crime but lower violent crime. Prospective residents should research specific blocks rather than relying on citywide averages, as safety can change dramatically within a few streets. Overall, Providence requires a vigilant, proactive approach to personal and property security, with the understanding that the city's justice system offers limited deterrence for habitual offenders.
* Values derived from national, state, county, city and local statistics and may differ in a specific area. Last updated: 2026-04-30T04:53:38.000Z
Narrative content on this page is AI-generated and may contain mistakes. Verify any details that matter before acting on them.
ReloMaps may earn a commission from affiliate links at no extra cost to you.