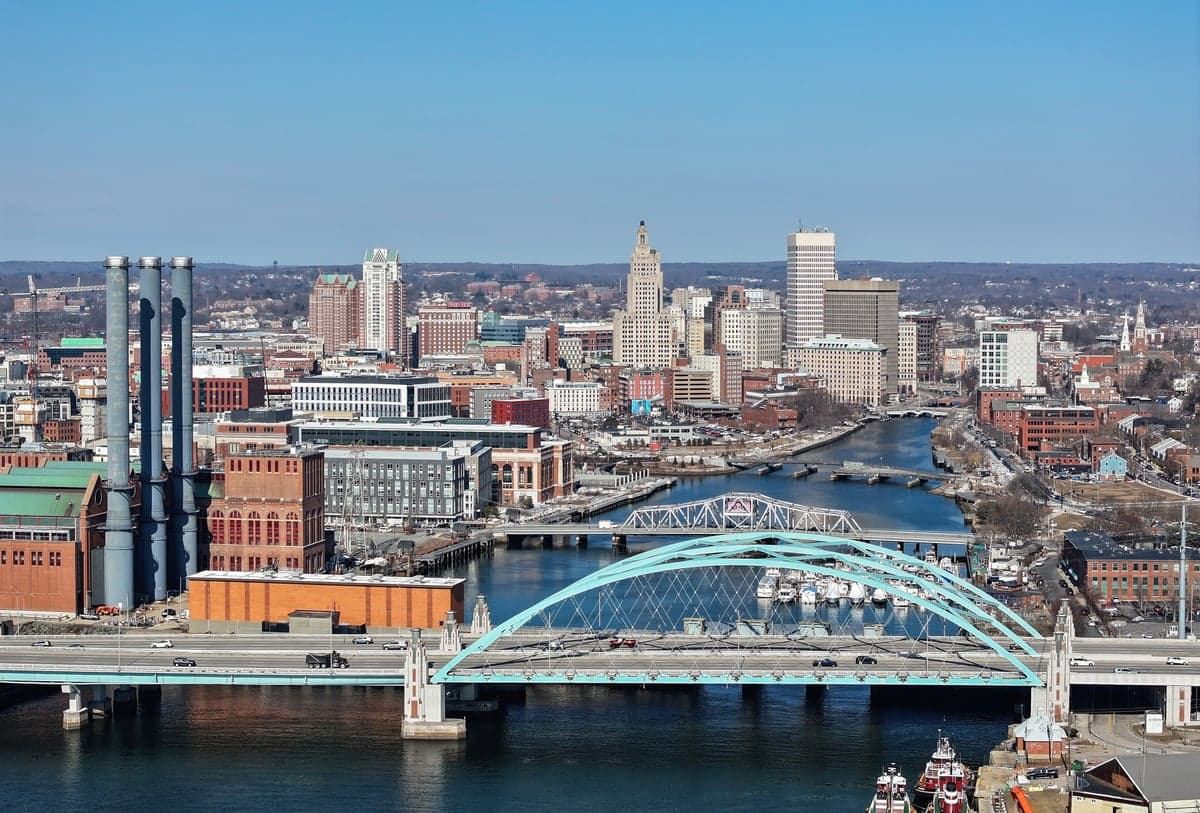
Photo: Wikipedia
Demographics of Providence, RI
Affluence Level in Providence, RI
A middle-class area roughly in line with national averages across income, home values, education, and employment.
People of Providence, RI
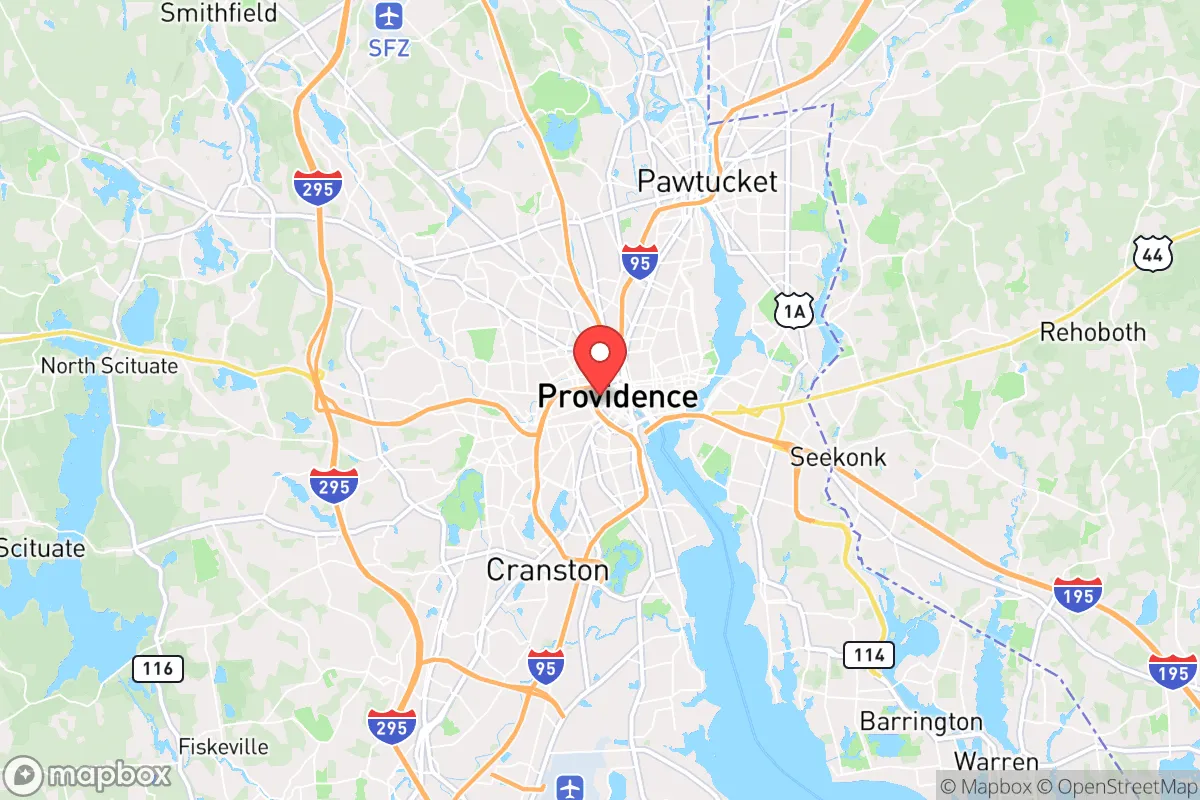
Providence, Rhode Island, is a dense, historic city of 190,214 residents where no single ethnic group holds a majority. Its population is 44.3% Hispanic, 34.0% White, 11.3% Black, 4.6% East/Southeast Asian, and 1.2% Indian (subcontinent), with 17.7% foreign-born. The city is characterized by sharp contrasts: a large college-educated cohort (34.7%) lives alongside working-class immigrant communities, and its neighborhoods remain strongly defined by the waves of migration that built them.
How the city was settled and grew
Founded in 1636 by Roger Williams as a haven for religious dissenters, Providence grew slowly as a maritime and manufacturing center. The first major population wave came from English and Irish immigrants in the 18th and early 19th centuries, who settled the East Side and College Hill areas near the port. The Industrial Revolution brought a massive influx of French-Canadian and Italian laborers between 1850 and 1920, who built dense tenement neighborhoods in Federal Hill (Italian) and Silver Lake (French-Canadian). By 1900, Providence was a majority-immigrant city, with textile mills and jewelry factories drawing successive waves of Portuguese, Polish, and Armenian workers to the South Side and Olneyville. These groups established tight-knit ethnic enclaves that persisted for generations, anchored by parish churches and mutual-aid societies.
Modern era (post-1965)
The 1965 Hart-Celler Act reshaped Providence’s demographics dramatically. The city’s White population, which had peaked at over 95% in 1950, began a steep decline as manufacturing jobs vanished and families moved to suburbs like Cranston and Warwick. Into this vacuum arrived a large wave of Dominican, Puerto Rican, and Guatemalan immigrants, who settled in South Providence, Elmwood, and Olneyville. By 2020, these neighborhoods had become predominantly Hispanic, with Spanish-language storefronts and bodegas replacing the old Italian and Irish shops. A smaller but significant influx of Liberian and Cape Verdean immigrants settled in the West End and Mount Pleasant during the 1990s and 2000s, adding to the Black population. Meanwhile, the East Side and College Hill retained their historic character as home to Brown University and the Rhode Island School of Design, attracting a highly educated, largely White and East/Southeast Asian population. The Indian (subcontinent) community, though small at 1.2%, is concentrated in professional households near the hospitals and universities.
The future
Providence’s population is trending toward a stable, majority-minority character. The Hispanic share has grown steadily from roughly 30% in 2000 to 44.3% today, driven by both immigration and higher birth rates, and is expected to approach 50% by 2035. The White share, now 34.0%, continues to decline slowly as older residents age out and younger White families choose suburbs or out-of-state destinations. The East/Southeast Asian and Indian populations are growing modestly, fueled by graduate students and tech workers at Brown and the Providence medical corridor. The Black population has plateaued, with little new immigration from Africa or the Caribbean. Neighborhoods are becoming more ethnically distinct rather than homogenizing: South Providence and Olneyville are solidifying as Hispanic enclaves, while the East Side remains a liberal, highly educated bubble. The city’s overall density (over 9,000 people per square mile) and high renter rate (60%) mean that newcomers will find a compact, walkable urban environment with strong ethnic identity in each district.
For someone moving in now, Providence offers a genuinely diverse, working-class city with a strong sense of place in each neighborhood. The trade-off is clear: you get historic architecture, walkable streets, and a vibrant food scene, but also face high property taxes, underfunded schools, and a city government that leans heavily Democratic. The population is becoming more Hispanic and more polarized by education and income, with the East Side growing wealthier and the South Side growing poorer. This is not a homogenizing suburb—it is a city of distinct, tribal neighborhoods where your experience will depend heavily on which block you choose.
* Values derived from national, state, county, city and local statistics and may differ in a specific area. Last updated: 2026-04-30T04:53:38.000Z
Narrative content on this page is AI-generated and may contain mistakes. Verify any details that matter before acting on them.
ReloMaps may earn a commission from affiliate links at no extra cost to you.