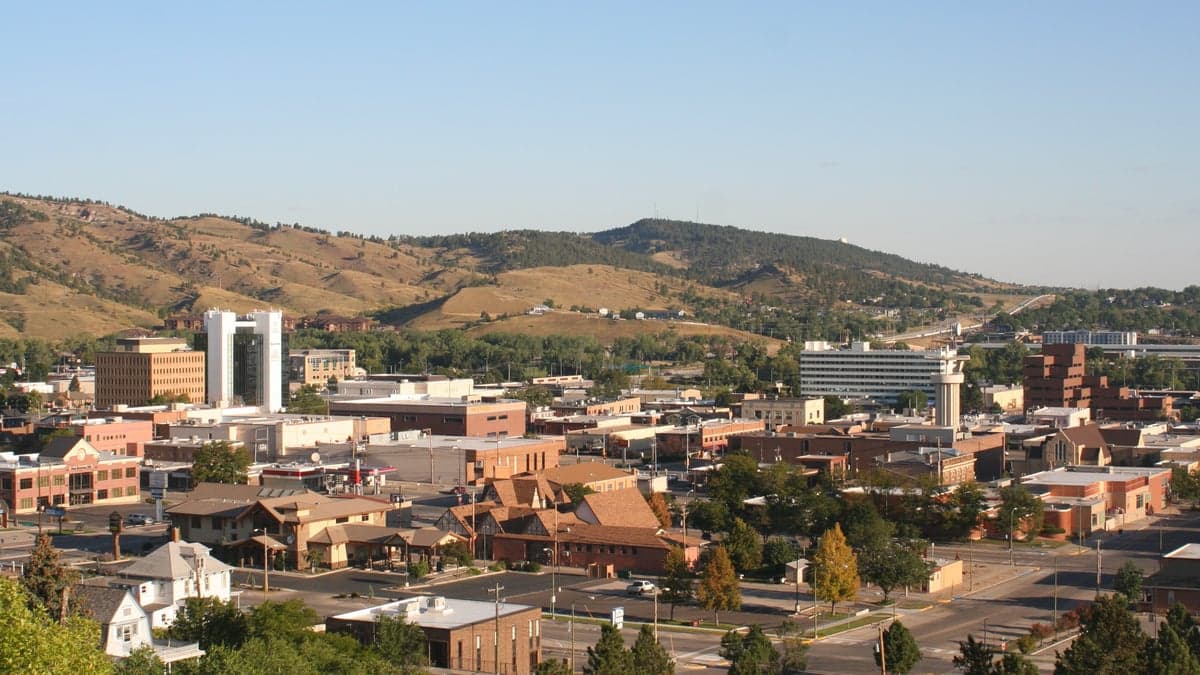
Photo: Wikipedia
Quality of Life in Rapid City, SD
Above-average quality of iife. The area offers a reasonable cost of living, decent mobility, and a mix of neighborhood amenities.
What does Quality of Life tell us?
Quality of Life blends cost of living, nearby amenities, socioeconomic signals, and neighborhood character. City-level scores represent the whole municipality; individual neighborhoods can differ.
What does this tell us?
Quality of Life blends cost of living, nearby amenities, socioeconomic signals, and neighborhood character. City-level scores represent the whole municipality; individual neighborhoods can differ.
Cost of Living
7% below national average
The Real Cost of Living in Rapid City, SD for 2026
| Tier | Individual | Family (4) |
|---|---|---|
| Survival | $17k | $32k |
| Comfortable | $52k | $77k |
| Luxury | $119k+ | $184k+ |
| Elite (Top 5%) | $155k+ | $241k+ |
85%
The Area Signal
A metric tracking the socioeconomic signals of the area.


Hobbies
Explore the areaGroceries
5 within 10 miles
Gas
0 within 10 miles
Hospital
3 within 20 miles
Airport
DEN — Denver International
Post Office
USPS — Rapid City, SD
Critical Amenities
Quality-of-Life Analysis
Rapid City offers a quality of life defined by modest affluence and a strong sense of community, attracting a mix of outdoor enthusiasts, military families connected to Ellsworth Air Force Base, and healthcare professionals drawn to Monument Health. With a cost of living index of 93 (well below the U.S. average of 100), the city provides a financial buffer that allows residents to prioritize recreation and homeownership. The population skews younger than the national median, and the local economy is anchored by stable sectors like healthcare, tourism, and defense, creating a resilient job market that supports a middle-class lifestyle.
Cost of living, housing, and affordability compared to nearby areas
Rapid City's affordability stands out sharply against both national averages and neighboring communities. The median home value of $270,000 is roughly 30% lower than the U.S. median, while median rent sits at $1,053 per month—making it significantly cheaper than comparable gateway cities like Bozeman, Montana (where median rent exceeds $1,600). Compared to nearby Box Elder or Sturgis, Rapid City offers more housing inventory and slightly lower per-square-foot costs, though prices have risen about 8% annually since 2020. The average commute of just 17.4 minutes is a major quality-of-life win, freeing up time that residents in larger metros lose to traffic. Utility costs and grocery prices also track below the national index, meaning a household earning the local median income of roughly $62,000 can comfortably afford a three-bedroom home without being cost-burdened.
What daily life is like for families: schools, amenities, and recreation
Daily life in Rapid City revolves around easy access to the Black Hills and a compact, walkable downtown. The Rapid City Area Schools district serves most families, with Stevens High School and South Middle School consistently earning above-average state ratings, though some elementary schools in the district face overcrowding. For amenities, the city punches above its weight: the Main Street Square hosts free summer concerts and a weekly farmers market, while the Black Hills Community Theatre and Dahl Arts Center provide cultural outlets. Outdoor recreation is the defining feature—residents can be hiking in Pactola Lake or Mount Rushmore National Memorial within 30 minutes of leaving work. The 17-minute average commute means families can realistically attend a 5:30 p.m. soccer practice at Parkview Field and still have time for dinner together. Healthcare access is robust, with Monument Health Rapid City Hospital serving as a regional trauma center, though specialists often require a referral to Sioux Falls for complex procedures.
Rapid City is best suited for people who value a slower pace, outdoor adventure, and financial breathing room over urban nightlife or career ladder-climbing in tech hubs. Retirees on fixed incomes benefit from the low cost of living and proximity to national parks, while remote workers can leverage the affordable housing and reliable internet (fiber coverage is expanding in newer subdivisions). Families with young children will appreciate the short commutes and safe neighborhoods, but should note that winter weather can disrupt school schedules and outdoor plans from November through March. The city's growth is steady but not explosive, meaning newcomers can still find a sense of belonging without the growing pains seen in Bozeman or Colorado Springs. For anyone seeking a balanced life where a $270,000 home and a 17-minute commute are realistic, Rapid City delivers.
Crime in Rapid City, SD
Significantly higher crime rates than 76% of comparable U.S. locations.
Violent CrimeViolent Crime Analysis
Property CrimeProperty Crime Analysis
Crime Analysis
Rapid City, South Dakota, reports a violent crime rate of 767.4 incidents per 100,000 residents and a property crime rate of 3,654.6 per 100,000, figures that place it well above both state and national averages. While the city is not among the most dangerous in the country, these numbers signal a significant public safety challenge, particularly when compared to similarly sized communities in the Midwest. The overall safety picture is one where residents face elevated risk, especially for property offenses, and where local law enforcement resources are frequently stretched thin.
Crime in context
To understand Rapid City’s crime landscape, it is essential to compare its rates to broader benchmarks. The national average for violent crime in 2024 was approximately 380 per 100,000, meaning Rapid City’s rate of 767.4 is roughly double the national figure. Property crime nationally sits around 1,950 per 100,000, making Rapid City’s 3,654.6 rate nearly 87% higher. Within South Dakota, the state violent crime average is about 410 per 100,000, so Rapid City’s rate is also significantly elevated. These comparisons indicate that the city’s crime problem is not merely a statistical anomaly but a persistent issue tied to local socioeconomic factors and, critically, to the policies of the local justice system. Pennington County, which encompasses Rapid City, has seen a pattern of progressive prosecutorial and judicial approaches that prioritize diversion and reduced sentencing. While intended to reduce incarceration, these policies have in practice contributed to a revolving door for repeat offenders, undermining deterrence and leaving victims with a sense that the system fails to hold criminals accountable.
What residents experience
For those living in Rapid City, the high property crime rate is the most tangible daily concern. Vehicle break-ins, theft from porches, and residential burglaries are common, particularly in areas near downtown and along major corridors like Mount Rushmore Road. Violent crime, while less frequent, is concentrated in specific neighborhoods and often involves disputes among individuals known to each other, though random assaults do occur. Residents report a heightened sense of vigilance, with many investing in security cameras, alarm systems, and neighborhood watch participation. The perception of inadequate consequences for offenders—driven by the aforementioned progressive justice policies—further erodes trust in public safety institutions. Many locals express frustration that property crimes are treated as low-priority offenses, leading to a normalization of theft and vandalism in everyday life.
Neighborhood-level variation is notable. Areas west of downtown, such as the Skyline Drive corridor and parts of the West Boulevard neighborhood, tend to have lower crime rates, while the central core, including the area around St. Joseph Street and the North Rapid neighborhoods, experiences the highest concentration of incidents. Suburban developments on the city’s southern and eastern edges, like those near Canyon Lake Park or the Rapid Valley area, offer comparatively safer environments, though property crime remains a concern citywide. Prospective residents should research specific blocks and consult local crime mapping tools, as safety can change dramatically within a few blocks.
* Values derived from national, state, county, city and local statistics and may differ in a specific area. Last updated: 2026-04-19T04:24:41.000Z
Narrative content on this page is AI-generated and may contain mistakes. Verify any details that matter before acting on them.
ReloMaps may earn a commission from affiliate links at no extra cost to you.