
Photo: Wikipedia
Quality of Life in Renton, WA
A high quality of life with strong walkability, manageable living costs, healthy neighborhood signals, and solid amenity access.
What does Quality of Life tell us?
Quality of Life blends cost of living, nearby amenities, socioeconomic signals, and neighborhood character. City-level scores represent the whole municipality; individual neighborhoods can differ.
What does this tell us?
Quality of Life blends cost of living, nearby amenities, socioeconomic signals, and neighborhood character. City-level scores represent the whole municipality; individual neighborhoods can differ.
Cost of Living
89% above national average
The Real Cost of Living in Renton, WA for 2026
| Tier | Individual | Family (4) |
|---|---|---|
| Survival | $31k | $58k |
| Comfortable | $109k | $161k |
| Luxury | $160k+ | $248k+ |
| Elite (Top 5%) | $188k+ | $292k+ |
60%
The Area Signal
A metric tracking the socioeconomic signals of the area.
Hobbies
Explore the areaGroceries
7 within 10 miles
Gas
20 within 10 miles
Hospital
20 within 20 miles
Airport
SEA — Seattle–Tacoma International
Post Office
USPS — Renton, WA
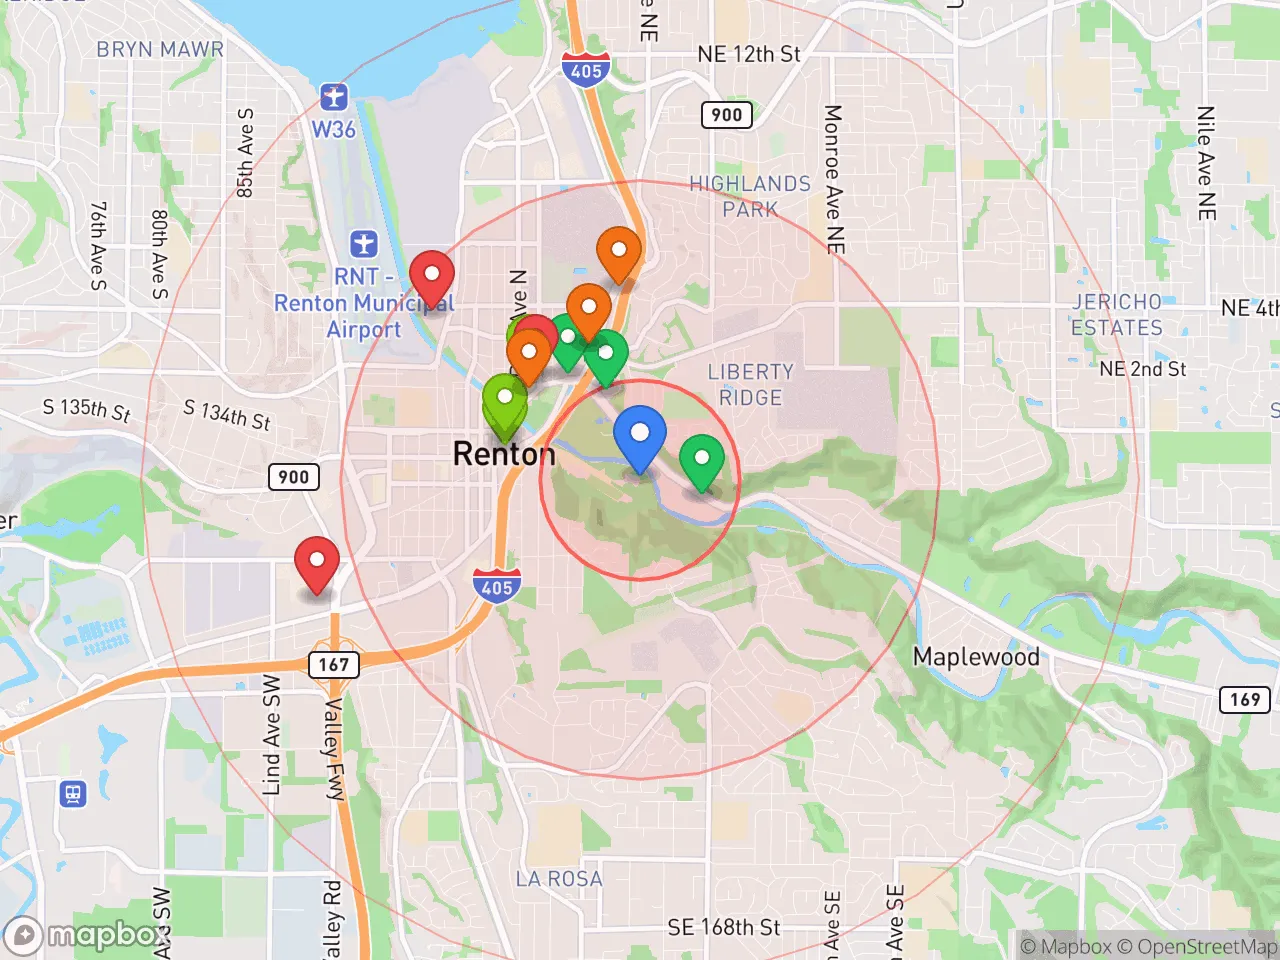
Critical Amenities
Quality-of-Life Analysis
Renton, Washington, presents a quality of life defined by its position as a more attainable alternative to Seattle while still commanding a cost of living index of 189—nearly double the national average. The city attracts a mix of Boeing engineers, Amazon and Microsoft commuters, and families seeking suburban stability with urban proximity. With a median home value of $631,400 and a median rent of $1,923, Renton sits squarely in the middle tier of King County’s housing market, offering relative affordability compared to Bellevue or Redmond but demanding a solid dual-income household to sustain a comfortable lifestyle.
Cost of living, housing, and how Renton compares to Seattle and the Eastside
Renton’s cost of living is 89% above the U.S. average, driven primarily by housing. The median home value of $631,400 is roughly $300,000 less than the Seattle median and nearly half that of Bellevue, making it one of the more accessible cities in King County for buyers. Median rent at $1,923 is about $400 below Seattle’s average, though still high by national standards. The average commute of 30.2 minutes reflects Renton’s strategic location: residents can reach downtown Seattle in 20–25 minutes via I-405 or Sounder commuter rail, while Boeing’s Everett and Renton plants are within a 15-minute drive. Property taxes remain moderate for the region, but state sales tax (10.1% in 2026) and high utility costs add to monthly outlays. For renters, the market is tight—vacancy rates hover around 3%—so securing a lease often requires quick action and proof of income at least 2.5 times the rent.
What daily life is like: amenities, schools, and neighborhood character
Daily life in Renton centers on its Lake Washington waterfront, the Landing shopping district, and a growing network of parks and trails. The city’s school system, Renton School District, includes several highly rated elementary schools like Hazelwood Elementary and the STEM-focused Renton High School, though families often supplement with private options such as St. Anthony School. The downtown core has seen a revival with new apartment complexes, breweries, and the Renton History Museum, while the Cedar River Trail provides a 7-mile paved path for cycling and walking. For groceries, the Renton Highlands area offers a mix of ethnic markets (H Mart, WinCo) and standard chains. The city’s diversity is a defining feature—over 40% of residents identify as Asian, Black, or Hispanic, giving neighborhoods a multicultural feel uncommon in other Seattle suburbs. Nightlife is limited compared to Seattle, but the proximity to the airport (SEA is 10 minutes away) makes Renton a practical base for frequent travelers.
Renton is best suited for professionals and families who prioritize shorter commutes to Boeing or Seattle tech hubs over walkable urban density. The city works well for those who value a lower housing price point than the Eastside, access to outdoor recreation (Lake Sammamish and Mount Rainier are within 30 minutes), and a community that feels both suburban and diverse. Retirees on fixed incomes may struggle with the cost of living, while young singles might find the social scene too quiet. For dual-income households earning a combined $120,000 or more, Renton offers a balanced quality of life that avoids the extremes of Seattle’s expense and the Eastside’s exclusivity.
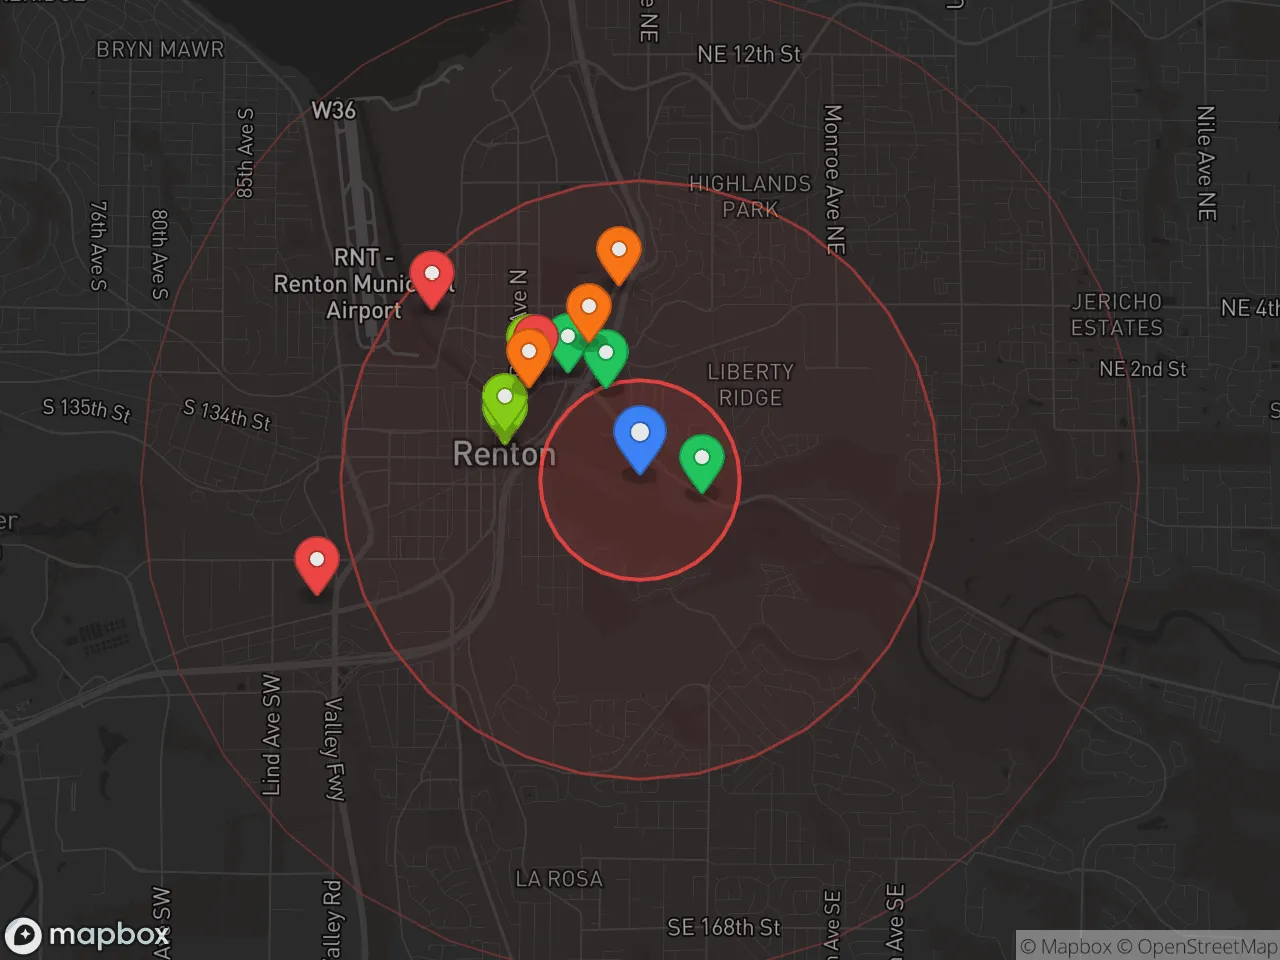
Crime in Renton, WA
Lower crime rates than 77% of comparable U.S. locations.
Violent CrimeViolent Crime Analysis
Property CrimeProperty Crime Analysis
Crime Analysis
Renton, Washington, presents a complex safety picture that requires careful examination. While the city's violent crime rate of 53.2 per 1,000 residents is notably lower than the national average, its property crime rate of 707.8 per 1,000 residents is significantly higher, creating a distinct risk profile for residents and newcomers. The overall safety experience in Renton is heavily shaped by its position within the broader Seattle metropolitan area, where progressive criminal justice policies have a direct impact on public safety outcomes.
Crime in context
Renton's violent crime rate of 53.2 per 1,000 residents is roughly half the national average, a statistic that might initially appear reassuring. However, this figure must be weighed against the city's property crime rate of 707.8 per 1,000 residents, which is substantially above the national median. The disparity between these two metrics is a common pattern in large metro areas with liberal and progressive district attorneys and judges. Such justice systems, while sympathetic to offenders, often result in more criminals remaining on the street, directly undermining justice for victims and the general public. This policy environment contributes to Renton's elevated property crime, as repeat offenders face fewer consequences.
What residents experience
For those living in Renton, the daily reality is shaped more by property crime than violent crime. Residents frequently report vehicle break-ins, package theft, and burglaries as persistent concerns. The city's proximity to Seattle and major highways like I-405 and I-5 makes it a convenient target for transient criminal activity. While violent incidents like assaults or robberies are less common, the high property crime rate creates a sense of vulnerability, particularly for those who park on the street or live in ground-floor apartments. The progressive judicial approach in King County, which includes reduced bail requirements and diversion programs for property offenders, means that many individuals arrested for these crimes are quickly back on the streets, perpetuating the cycle.
Neighborhood-level variation
Safety in Renton is not uniform across the city. The downtown core and areas near the Renton Transit Center tend to experience higher concentrations of property crime and nuisance offenses. In contrast, neighborhoods like the Highlands and Kennydale generally report lower crime rates, benefiting from stronger community watch programs and less foot traffic from transient populations. Newcomers should research specific blocks and apartment complexes, as crime can vary dramatically even within a single ZIP code. The safest strategy is to choose a residence in a quieter, residential pocket and invest in robust security measures, as the broader county-level justice policies provide limited deterrent effect against property crime.
* Values derived from national, state, county, city and local statistics and may differ in a specific area. Last updated: 2026-04-21T11:12:22.000Z
Narrative content on this page is AI-generated and may contain mistakes. Verify any details that matter before acting on them.
ReloMaps may earn a commission from affiliate links at no extra cost to you.