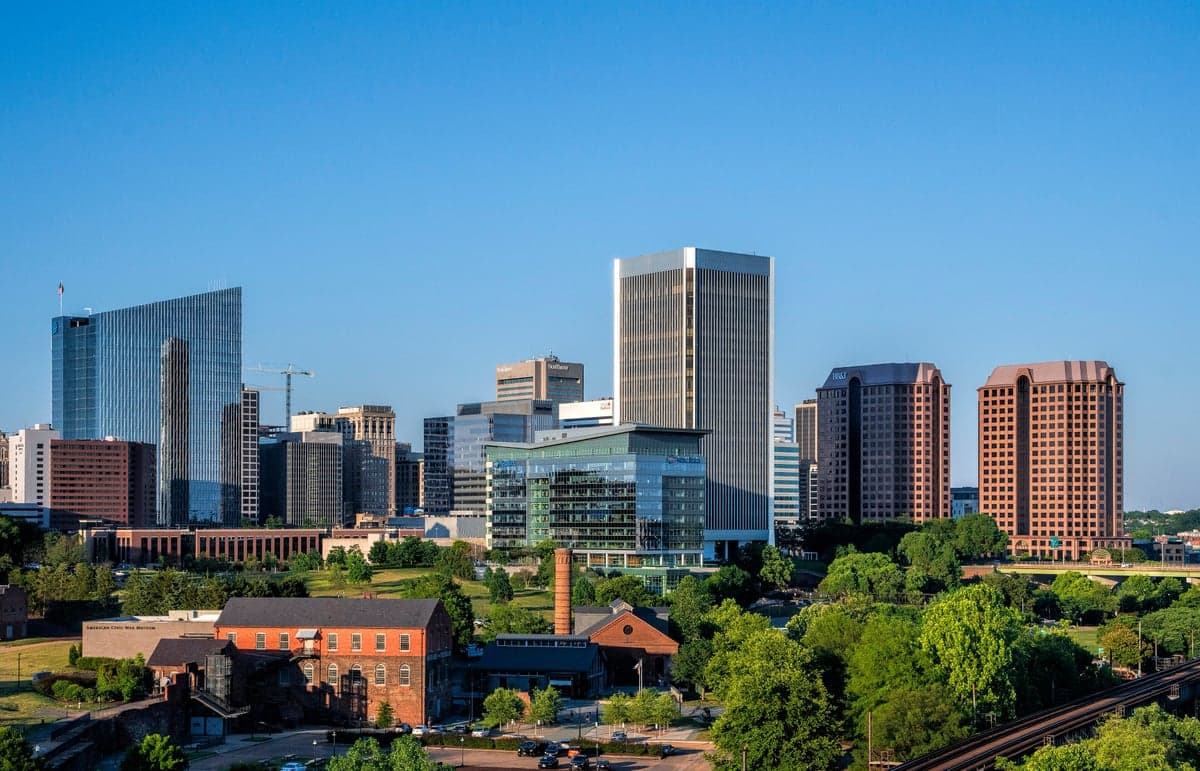
Photo: Wikipedia
Demographics of Richmond, VA
Affluence Level in Richmond, VA
A middle-class area roughly in line with national averages across income, home values, education, and employment.
People of Richmond, VA
Richmond, Virginia, is a city of stark demographic duality: roughly 41% Black and 41% White, with a modest but growing Hispanic population of 10.3% and a small East/Southeast Asian community at 1.5%. With 227,595 residents, it is denser and more urban than most Southern capitals, yet its foreign-born share sits at just 6.0%—well below the national average. The city’s identity is shaped by its layered history as a colonial trading hub, a Confederate capital, and a modern center for government and finance, producing a population that is both deeply rooted and increasingly polarized by neighborhood.
How the city was settled and grew
Richmond was founded in 1737 on the fall line of the James River, a location that made it a natural transshipment point for tobacco. The original European settlers were English and Scottish merchants who established plantations and warehouses along the river. By the early 19th century, the city became a major hub for the domestic slave trade, with thousands of enslaved Africans forced into the city—many passing through the notorious Lumpkin’s Slave Jail in what is now Shockoe Bottom. This area, along with Church Hill, became the early residential core for both wealthy White merchants and the enslaved laborers who built their homes. After the Civil War, freed Black families established independent communities in Jackson Ward, which by the early 1900s was known as the "Black Wall Street of the South" due to its thriving Black-owned businesses and banks. Meanwhile, German and Irish immigrants arrived in the mid-1800s to work in the Tredegar Iron Works and tobacco factories, settling in Oregon Hill and Manchester across the river.
Modern era (post-1965)
The 1960s and 1970s brought dramatic demographic shifts. White flight accelerated after the 1968 school desegregation orders, pushing many middle-class White families to the surrounding counties of Henrico and Chesterfield. This left Richmond’s population majority-Black by the 1980s—a trend that peaked around 57% Black in the 1990 census. The post-1965 Hart-Cellar Act had a muted effect on Richmond compared to coastal cities; the foreign-born share remained low, with the largest immigrant wave being Hispanic (primarily from Central America) settling in Southside neighborhoods like Woodland Heights and along the Hull Street corridor. East/Southeast Asian communities, mostly Vietnamese and Korean, arrived in smaller numbers during the 1980s and 1990s, clustering in the West End near the University of Richmond and in parts of Henrico County just outside the city limits. The Indian-subcontinent population (0.6%) is tiny and largely composed of professionals working in healthcare and tech, concentrated in the Museum District and the Fan. Since 2000, Richmond has seen a reversal of White flight: young professionals and empty-nesters have repopulated historic neighborhoods like the Fan, Church Hill, and Scott’s Addition, driving the White share back up to 41% and creating a visible gentrification dynamic in formerly Black-majority areas.
The future
Richmond’s population is slowly homogenizing in its core neighborhoods while tribalizing along economic lines. The city’s overall population has been flat to slightly declining since 2020, but the composition is shifting: the Black share is gradually falling (from 48% in 2010 to 41.6% today), while the White share is rising due to in-migration from other states and from the suburbs. The Hispanic share is growing steadily, projected to reach 12-14% by 2035, driven by both natural increase and continued immigration from Central America. The East/Southeast Asian and Indian populations are likely to remain small but stable, anchored by the medical and academic sectors. The most significant trend is the intensifying economic segregation: the Fan and Museum District are becoming overwhelmingly White and college-educated (44.1% of the city holds a bachelor’s degree or higher), while Southside and East End neighborhoods remain majority-Black and lower-income. The city is not becoming a melting pot; it is becoming a patchwork of distinct enclaves divided by race, class, and education level.
For someone moving to Richmond now, the city offers a choice of worlds: a revitalized, walkable urban core with historic architecture and a growing food scene, or older, more affordable neighborhoods with deep community ties but fewer amenities. The demographic trajectory points toward continued gentrification of the central districts, a steady Hispanic expansion in the Southside, and a slow decline in the Black population share. Richmond is becoming more diverse in some ways, but more segregated in others—a reality any new resident should understand before choosing a neighborhood.
* Values derived from national, state, county, city and local statistics and may differ in a specific area. Last updated: 2026-05-01T21:27:23.000Z
Narrative content on this page is AI-generated and may contain mistakes. Verify any details that matter before acting on them.
ReloMaps may earn a commission from affiliate links at no extra cost to you.