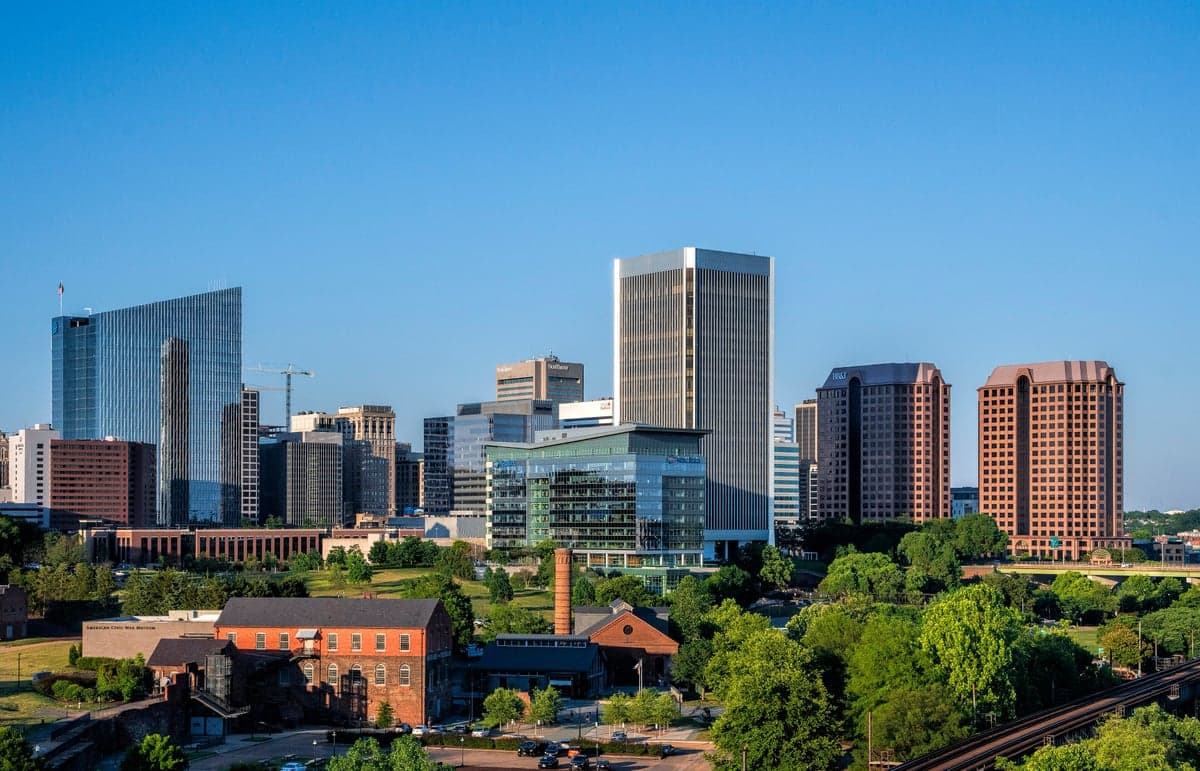

Photo: Wikipedia
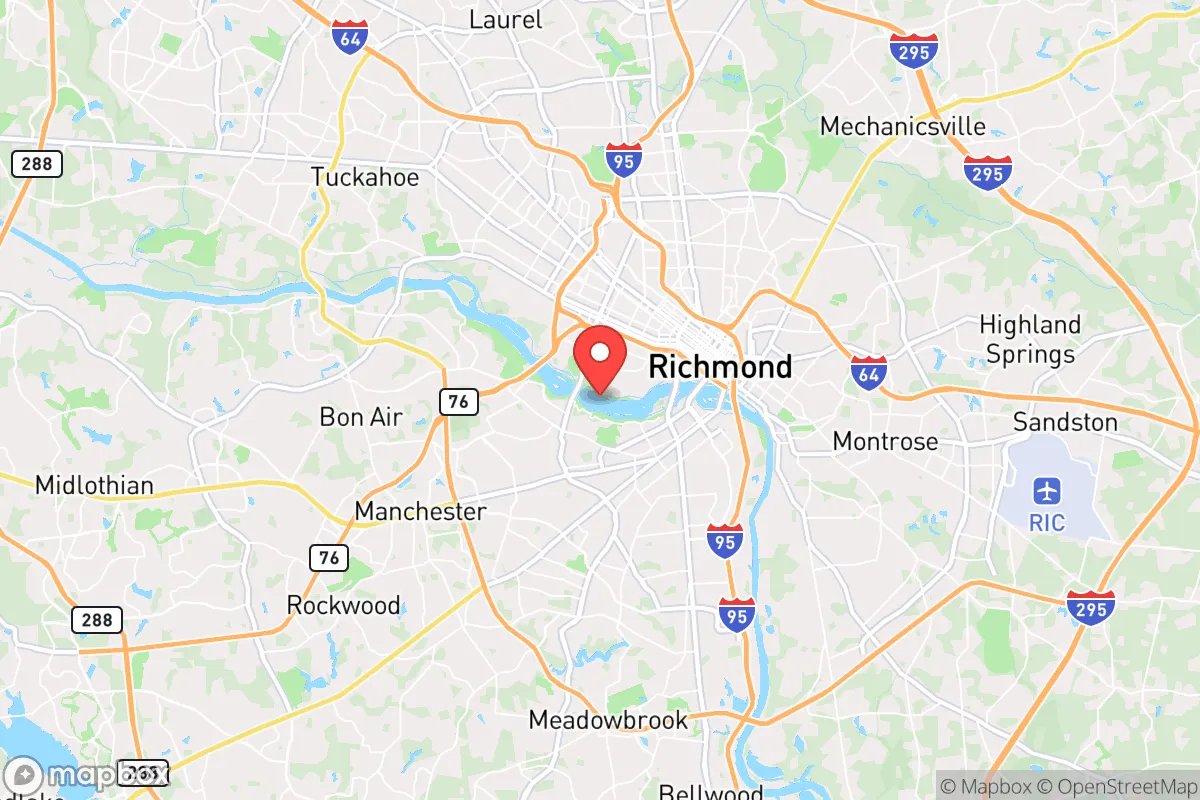
Quality of Life in Richmond, VA
Above-average quality of iife. The area offers a reasonable cost of living, decent mobility, and a mix of neighborhood amenities.
What does Quality of Life tell us?
Quality of Life blends cost of living, nearby amenities, socioeconomic signals, and neighborhood character. City-level scores represent the whole municipality; individual neighborhoods can differ.
What does this tell us?
Quality of Life blends cost of living, nearby amenities, socioeconomic signals, and neighborhood character. City-level scores represent the whole municipality; individual neighborhoods can differ.
Cost of Living
14% above national average
The Real Cost of Living in Richmond, VA for 2026
| Tier | Individual | Family (4) |
|---|---|---|
| Survival | $21k | $39k |
| Comfortable | $64k | $94k |
| Luxury | $113k+ | $175k+ |
| Elite (Top 5%) | $169k+ | $262k+ |
67%
The Area Signal
A metric tracking the socioeconomic signals of the area.
Hobbies
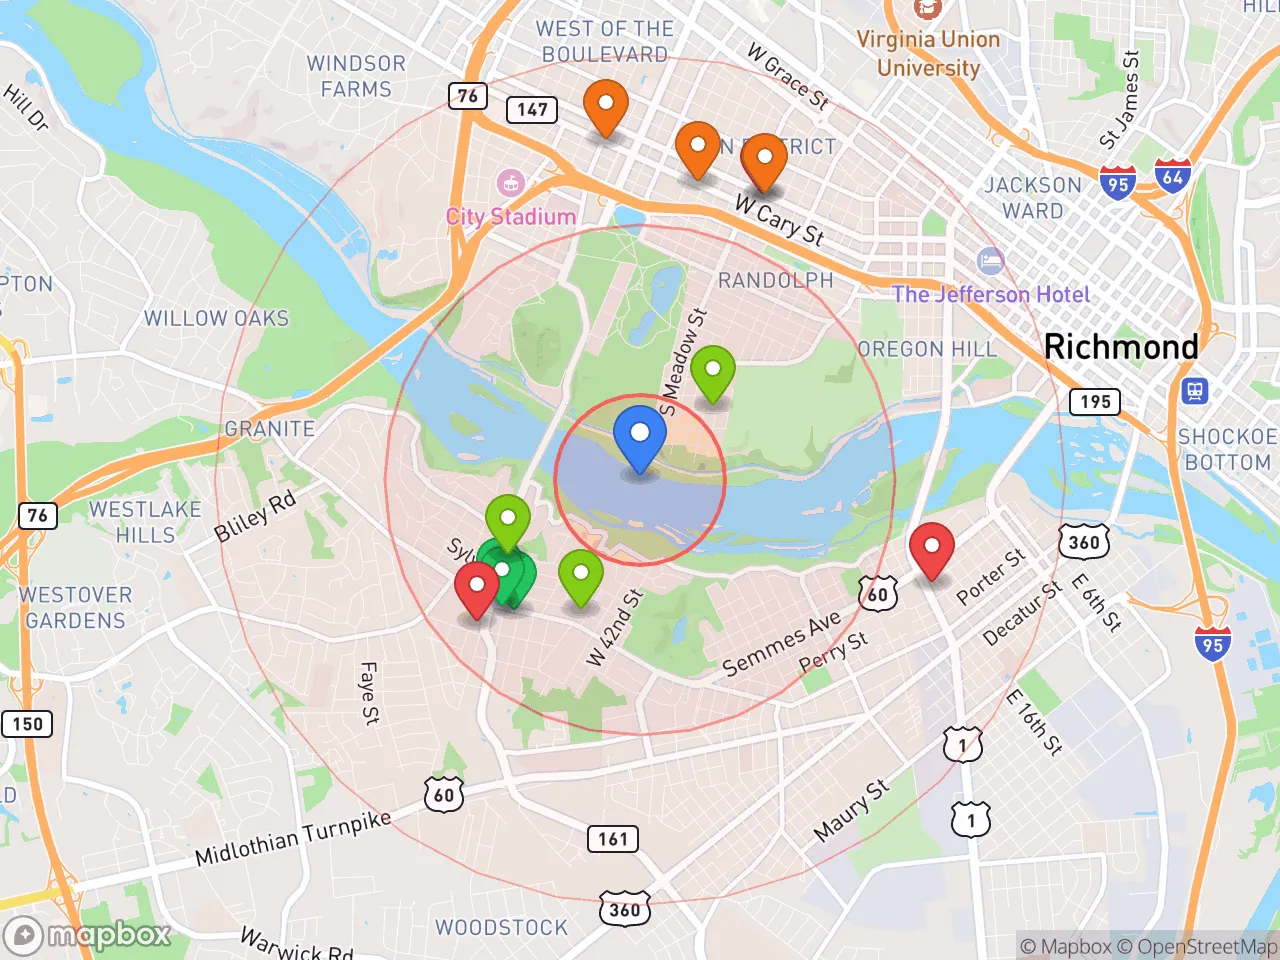
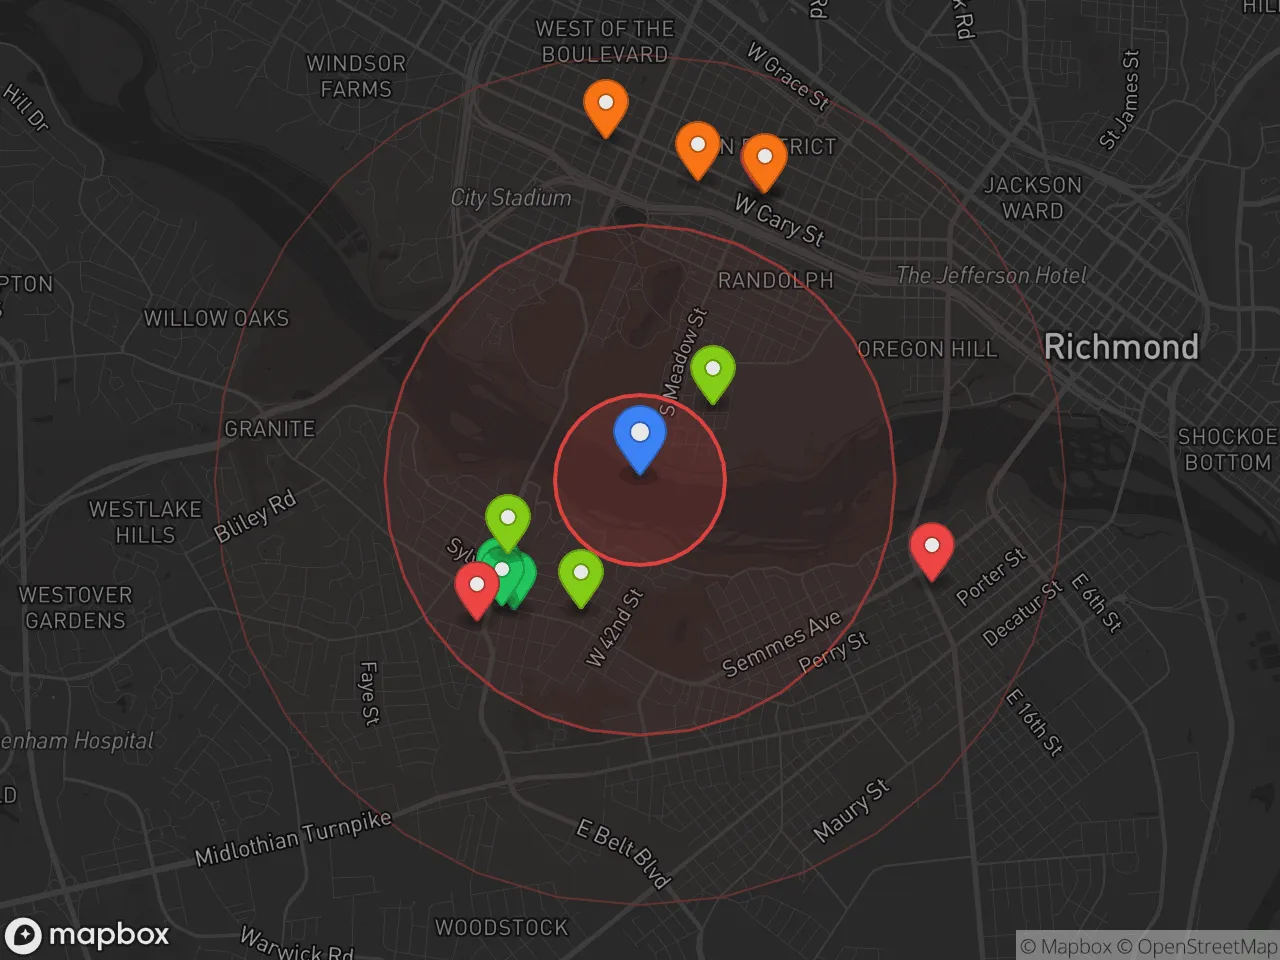
Explore the areaGroceries
7 within 10 miles
Gas
20 within 10 miles
Hospital
18 within 20 miles
Airport
DCA — Ronald Reagan Washington National
Post Office
USPS — Richmond, VA
Critical Amenities
Quality-of-Life Analysis
Richmond, Virginia, attracts a mix of young professionals, families, and empty-nesters drawn by its blend of historic charm, growing job market, and relatively moderate cost of living for a mid-Atlantic capital. The city’s affluence is concentrated in neighborhoods like the Fan, Museum District, and Church Hill, where restored Victorian homes and walkable streets command premium prices, while more affordable options exist in areas like Southside and Northside. The overall population skews educated and civic-minded, with a strong presence of state government workers, healthcare professionals from VCU Health, and creatives tied to the city’s thriving arts and food scenes.
Cost of living and housing affordability compared to Northern Virginia
Richmond’s cost of living index sits at 114, meaning it is 14% more expensive than the national average but significantly cheaper than the Washington, D.C., suburbs. The median home value of $328,100 is roughly half of what buyers face in Arlington or Fairfax County, making Richmond a popular relocation choice for those priced out of Northern Virginia. Median rent of $1,314 is also well below the D.C. metro average, though it has risen about 20% since 2020, squeezing lower-income renters. The average commute of 22 minutes is a standout advantage—far shorter than the 35–45 minute commutes common in the D.C. area—and is achievable thanks to the city’s compact layout and limited highway congestion outside peak hours. Property taxes in Richmond are moderate, with a rate of roughly $1.20 per $100 of assessed value, though city taxes on personal property (cars) are notably higher than in surrounding counties like Chesterfield or Henrico.
Everyday amenities, schools, and neighborhood rhythm
Daily life in Richmond revolves around its walkable neighborhoods, each with a distinct character. The Fan and Carytown offer boutique shopping, independent coffee shops, and the Virginia Museum of Fine Arts, while Scott’s Addition has become a hub for craft breweries and cideries. The James River runs through the city, providing year-round outdoor recreation—kayaking, mountain biking on the Buttermilk Trail, and the popular Pipeline Trail for walking. Public schools are a mixed bag: Richmond Public Schools (RPS) have struggled with funding and performance, but magnet programs like Open High School and Community High School are well-regarded. Many families opt for private schools (e.g., Collegiate School, St. Catherine’s) or move to Henrico or Chesterfield counties for higher-rated public systems. The city’s food scene is a major draw, with James Beard-nominated restaurants like L’Opossum and Mama J’s, plus a strong farmers’ market culture at the 17th Street Market. Cultural events such as the Richmond Folk Festival and the Dominion Energy Riverrock outdoor festival anchor the calendar year.
Richmond is best suited for people who value urban amenities—arts, dining, walkability—without the extreme costs of larger East Coast cities. Young professionals and remote workers will appreciate the short commute and relatively affordable housing, while families should weigh the school district options carefully before committing. Empty-nesters and retirees often gravitate to the Museum District or Church Hill for historic architecture and proximity to VCU Medical Center. The city’s political climate is reliably Democratic, with a growing progressive tilt, but the surrounding counties remain more conservative, creating a noticeable urban-suburban cultural divide. Overall, Richmond offers a high quality of life for those who prioritize a manageable cost of living, outdoor access, and a vibrant, mid-sized city experience.
Crime in Richmond, VA
Higher crime rates than 72% of comparable U.S. locations.
Violent CrimeViolent Crime Analysis
Property CrimeProperty Crime Analysis
Crime Analysis
Richmond, Virginia, reports a violent crime rate of 430.9 incidents per 100,000 residents and a property crime rate of 3,313.2 per 100,000, placing it above both state and national averages. While certain historic districts and suburban pockets offer relative safety, the city as a whole presents elevated risk, particularly for property-related offenses. The presence of progressive prosecutorial policies in the Richmond justice system is a significant factor that directly contributes to higher recidivism and reduced public safety, a pattern seen in many large metro areas.
Crime in context
Richmond’s violent crime rate is roughly 15% higher than the national average of approximately 380 per 100,000, while its property crime rate exceeds the national figure by nearly 30%. Compared to Virginia’s statewide violent crime rate of roughly 220 per 100,000, Richmond is nearly twice as dangerous. The city’s crime index is comparable to other mid-Atlantic urban centers like Baltimore and Norfolk, but significantly worse than Virginia suburbs such as Henrico or Chesterfield counties. These elevated numbers are not merely statistical anomalies—they reflect real consequences of a criminal justice system that prioritizes offender rehabilitation over victim protection and public order.
What residents experience
Residents report that property crime—especially vehicle break-ins, package theft, and home burglaries—is a near-daily concern in many central neighborhoods. Violent incidents, including aggravated assault and robbery, are concentrated in areas like the East End, Southside, and parts of North Richmond, though no neighborhood is entirely insulated. The city’s progressive district attorney’s office has implemented policies such as reduced cash bail, diversion programs for repeat offenders, and lenient plea deals, which critics argue embolden criminals and undermine deterrence. For example, a 2023 analysis by the Richmond Police Department found that over 40% of property crime arrests involved individuals previously released under these policies. This creates a cycle where victims see perpetrators return to the same streets, eroding trust in the justice system.
Neighborhood-level variation
Safety varies dramatically by neighborhood. The Fan District and Museum District enjoy lower crime rates due to higher property values, active neighborhood watches, and more police patrols. In contrast, areas like Gilpin Court, Mosby, and Creighton Court experience violent crime rates three to five times the city average. Suburban neighborhoods in the far West End and near the James River offer a safer alternative, with property crime rates closer to the national average. However, even these areas are not immune to spillover from the city’s broader crime trends, particularly car theft and smash-and-grab robberies. For those considering relocation, the safest choice is to live in a well-established, higher-income neighborhood or a surrounding county, while remaining aware that Richmond’s progressive justice policies create a citywide environment of elevated risk.
* Values derived from national, state, county, city and local statistics and may differ in a specific area. Last updated: 2026-05-01T21:27:23.000Z
Narrative content on this page is AI-generated and may contain mistakes. Verify any details that matter before acting on them.
ReloMaps may earn a commission from affiliate links at no extra cost to you.