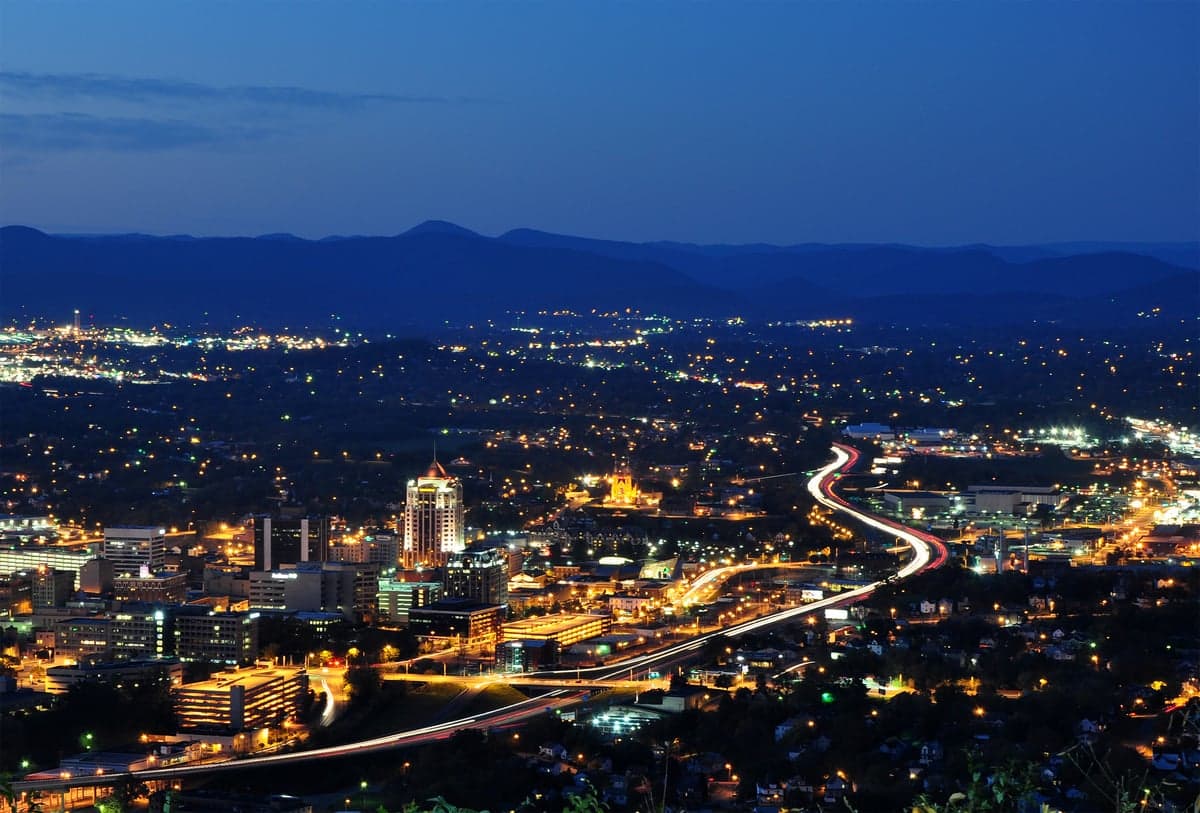
Photo: Wikipedia
Demographics of Roanoke, VA
Affluence Level in Roanoke, VA
A below-average socioeconomic profile. Incomes, home values, and educational attainment trail the U.S., with higher poverty and unemployment.
People of Roanoke, VA
The people of Roanoke, VA today number 98,677, forming a majority-minority city where White residents make up 55.5% of the population, Black residents 28.5%, Hispanic residents 8.6%, East/Southeast Asian residents 2.2%, and Indian-subcontinent residents 0.9%. The city is notably less diverse than Virginia as a whole, with a foreign-born share of just 4.8% compared to the state's 12.7%, and a college-educated rate of 28.9% that trails the national average. Roanoke's identity remains rooted in its railroad and manufacturing heritage, with a population that is older, more native-born, and more economically anchored to traditional industries than the fast-growing suburbs of Northern Virginia or the Research Triangle.
How the city was settled and grew
Roanoke was not a colonial settlement but a railroad boomtown, incorporated in 1882 after the Norfolk and Western Railway chose the site for its headquarters and locomotive shops. The original population was overwhelmingly White and native-born, drawn from the surrounding Appalachian countryside and from other railroad towns in the Mid-Atlantic. The Norfolk and Western Shops, which employed thousands in railcar construction and repair, became the city's economic engine and the reason for its early growth. The first major non-White wave arrived in the 1880s and 1890s as Black laborers moved from rural Southwest Virginia and North Carolina to work in the rail yards and related industries. These families settled primarily in Gainsboro, the historic Black neighborhood just north of the downtown rail corridor, and in Northeast Roanoke, which became the city's most concentrated African American district. A smaller wave of Italian and Eastern European immigrants came in the 1900s-1920s, working in the rail shops and in the city's growing furniture and textile mills; they clustered in Old Southwest and the Riverside neighborhood near the Roanoke River. By 1950, Roanoke's population peaked at 91,921, with a demographic profile that was roughly 75% White and 25% Black, with negligible foreign-born presence.
Modern era (post-1965)
The post-1965 period in Roanoke was defined not by new immigration but by suburbanization and White flight. The Hart-Cellar Act had little immediate effect on Roanoke; the city's foreign-born share remained below 3% through the 1990s. Instead, the major demographic shift was internal: White families moved in large numbers from the city to surrounding counties, particularly Roanoke County to the north and west, and to the town of Vinton to the east. This depopulated the city's historic White neighborhoods like Raleigh Court and Wasena, which saw declining density and aging housing stock. Meanwhile, Black residents who had been concentrated in Gainsboro and Northeast Roanoke began moving into formerly White areas like Southeast Roanoke and parts of South Roanoke, though the city remained highly segregated by census tract. The Hispanic population, which grew from negligible in 1990 to 8.6% by 2020, arrived primarily from Mexico and Central America, working in construction, landscaping, and poultry processing. These families concentrated in Northwest Roanoke and along the Melrose Avenue corridor, where a small but visible Hispanic commercial district emerged. The East/Southeast Asian population (2.2%) is largely Vietnamese and Korean, with a cluster of families in South Roanoke near the Carilion Roanoke Memorial Hospital, where many work in healthcare. The Indian-subcontinent population (0.9%) is smaller and more dispersed, with no single concentrated neighborhood.
The future
Roanoke's population is projected to remain flat or decline slightly over the next decade, as the city has not experienced the rapid growth seen in Virginia's suburban and exurban corridors. The White population is aging and shrinking, while the Hispanic and Asian populations are growing slowly from a small base. The Black population is stable but not growing, as younger Black residents tend to leave for larger metro areas with more job opportunities. The city is not homogenizing into a single demographic bloc; instead, it is becoming more tribalized along neighborhood lines, with Gainsboro and Northeast Roanoke remaining heavily Black, Northwest Roanoke becoming increasingly Hispanic, and the western neighborhoods like Raleigh Court and South Roanoke staying predominantly White. The foreign-born share is likely to rise slowly, possibly reaching 6-7% by 2035, but Roanoke will remain one of the least immigrant-heavy cities in Virginia. The biggest wildcard is whether the city can attract and retain young college-educated residents, which would require a significant expansion of the healthcare and technology sectors beyond the current anchor of Carilion Clinic.
For someone moving in now, Roanoke offers a stable, low-cost, and relatively safe environment with a population that is older, more rooted, and less transient than in fast-growing metros. The city is becoming slightly more diverse but remains deeply segregated by neighborhood, and the foreign-born presence is small enough that it does not drive significant cultural or political change. The bottom line: Roanoke is a slow-changing, historically grounded city where the population story is one of stability and gradual diversification, not transformation.
* Values derived from national, state, county, city and local statistics and may differ in a specific area. Last updated: 2026-05-02T05:03:55.000Z
Narrative content on this page is AI-generated and may contain mistakes. Verify any details that matter before acting on them.
ReloMaps may earn a commission from affiliate links at no extra cost to you.