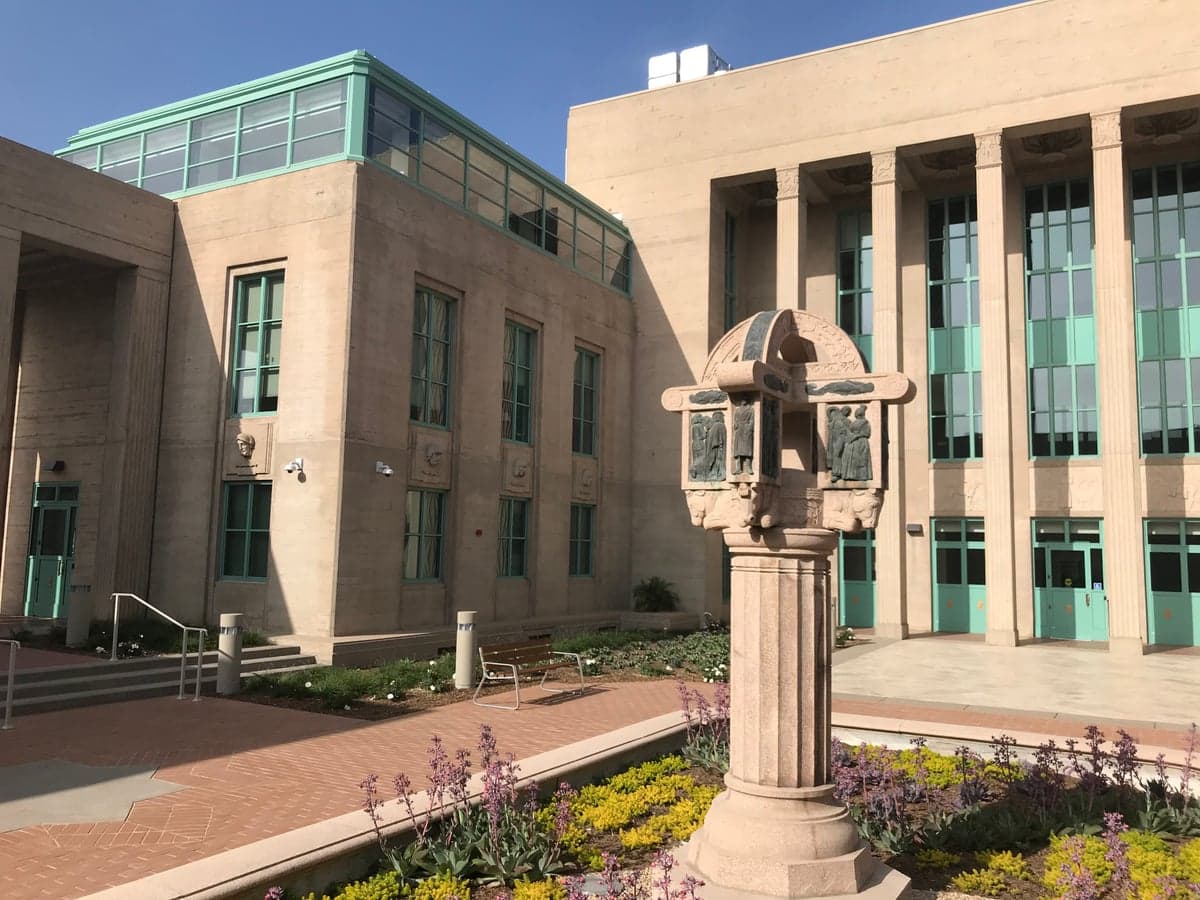
Photo: Wikipedia
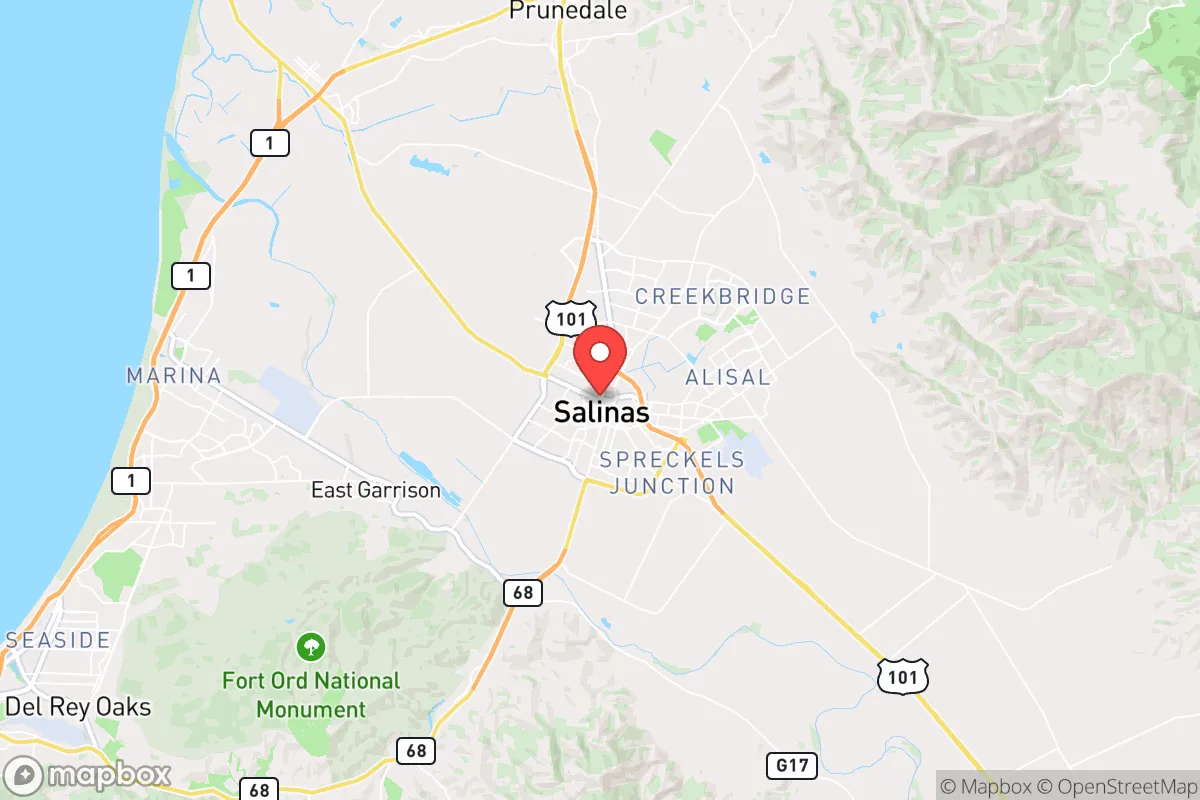
Demographics of Salinas, CA
Affluence Level in Salinas, CA
A middle-class area roughly in line with national averages across income, home values, education, and employment.
People of Salinas, CA
Salinas, California, is a majority-Hispanic city of 161,993 residents, where 80.3% of the population identifies as Hispanic or Latino, and just 11.5% as non-Hispanic White. It is a dense, working-class agricultural hub—the county seat of Monterey County—with a foreign-born population of 27.3%, overwhelmingly from Mexico and Central America. The city’s identity is shaped by its deep roots in the farm labor movement, a strong Catholic and family-oriented culture, and a growing East/Southeast Asian community (5.0%) concentrated in specific neighborhoods. For a conservative-leaning audience, Salinas represents a place where traditional family structures, religious observance, and agricultural work ethic remain central, but where educational attainment (15.5% college-educated) and economic mobility lag behind state averages.
How the city was settled and grew
Salinas was founded in 1868 as a railroad town and agricultural service center, replacing the earlier Mexican-era settlement of Natividad. The original population was a mix of Anglo-American homesteaders drawn by the 1850s land grants (Rancho Las Salinas, Rancho Nacional) and Mexican-Californio ranching families who had been in the region since the 1830s. By the early 1900s, the city’s economy was dominated by sugar beet and lettuce production, which attracted successive waves of immigrant labor. The first major non-Anglo group were Japanese immigrants, who arrived around 1900 and established a strong presence in the Chinatown district (near Soledad Street and Market Street), working as farm laborers and later as independent truck farmers. After the 1906 San Francisco earthquake, a small wave of Italian and Portuguese immigrants settled in the Alisal neighborhood (east of the railroad tracks), working in the packing sheds and as small-scale farmers. The Dust Bowl migration of the 1930s brought Anglo-Okie families to the Santa Rita area (southwest Salinas), many of whom later moved into white-collar roles as the city’s government and service sectors expanded. By 1950, Salinas was roughly 85% non-Hispanic White, with a significant Japanese-American minority that was largely interned during World War II and never fully recovered its pre-war population.
Modern era (post-1965)
The 1965 Hart-Cellar Act and the end of the Bracero program in 1964 triggered a massive demographic shift. Mexican-American farmworkers, many from Jalisco and Michoacán, began settling permanently in the Alisal neighborhood (east of Highway 101), which by 1980 had become the city’s primary Hispanic enclave. This area, once home to Italian and Portuguese families, saw rapid white flight through the 1970s and 1980s. A second wave of Mexican and Central American immigrants—many from Oaxaca and Guatemala—arrived in the 1990s and 2000s, settling in the Hebert Park area (north-central Salinas) and the Boronda neighborhood (unincorporated but functionally part of the city). The non-Hispanic White population collapsed from roughly 50% in 1970 to 11.5% today, with most Anglo families moving to the Harden Ranch and Creekbridge subdivisions (southwest Salinas) or to adjacent cities like Prunedale and Monterey. The East/Southeast Asian population (5.0%) is primarily Filipino and Vietnamese, concentrated in the Harden Ranch and Laurelwood areas, many working in healthcare and hospitality rather than agriculture. The Indian-subcontinent population (0.3%) is negligible, mostly professionals tied to the nearby Naval Postgraduate School in Monterey.
The future
Salinas is becoming more Hispanic, not less. The Hispanic share has risen from 65% in 2000 to 80.3% today, driven by both continued immigration and higher birth rates among Hispanic families. The non-Hispanic White population is aging and shrinking, with many younger Anglos leaving for college and not returning. The East/Southeast Asian community is stable but not growing rapidly, as most new Asian immigrants in Monterey County settle in Seaside or Marina. The city is not tribalizing into distinct enclaves so much as homogenizing into a single, large Hispanic-majority city—the Alisal neighborhood remains the most densely Hispanic, but even historically Anglo areas like Harden Ranch are now 40-50% Hispanic. The foreign-born share (27.3%) is plateauing, as second- and third-generation Mexican-Americans now make up the majority of the Hispanic population. The next 10-20 years will likely see Salinas become 85-90% Hispanic, with a small, older Anglo minority concentrated in the southwest hills and a modest Filipino-Vietnamese community in the newer subdivisions. Educational attainment (15.5% college-educated) may rise slowly as the city invests in Hartnell College and CSU Monterey Bay, but the economy remains heavily tied to agriculture and low-wage services.
For someone moving in now, Salinas is a solidly working-class, family-oriented, and culturally Mexican city where Spanish is heard as often as English. It is not a place of rapid upward mobility or high educational opportunity, but it offers strong community ties, low crime relative to similarly sized California cities, and a cost of living that is moderate by coastal California standards. The population trajectory is clear: Salinas will continue to be a Hispanic-majority agricultural hub, with little demographic diversification beyond that core identity.
* Values derived from national, state, county, city and local statistics and may differ in a specific area. Last updated: 2026-04-19T08:41:49.000Z
Narrative content on this page is AI-generated and may contain mistakes. Verify any details that matter before acting on them.
ReloMaps may earn a commission from affiliate links at no extra cost to you.