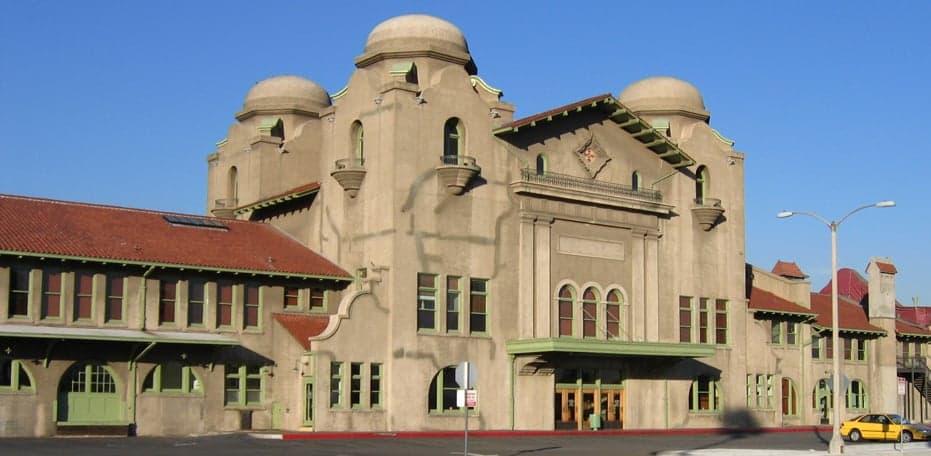
Photo: Wikipedia
Quality of Life in San Bernardino, CA
A high quality of life with strong walkability, manageable living costs, healthy neighborhood signals, and solid amenity access.
What does Quality of Life tell us?
Quality of Life blends cost of living, nearby amenities, socioeconomic signals, and neighborhood character. City-level scores represent the whole municipality; individual neighborhoods can differ.
What does this tell us?
Quality of Life blends cost of living, nearby amenities, socioeconomic signals, and neighborhood character. City-level scores represent the whole municipality; individual neighborhoods can differ.
Cost of Living
29% above national average
The Real Cost of Living in San Bernardino, CA for 2026
| Tier | Individual | Family (4) |
|---|---|---|
| Survival | $23k | $43k |
| Comfortable | $69k | $102k |
| Luxury | $102k+ | $157k+ |
| Elite (Top 5%) | $119k+ | $185k+ |
63%
The Area Signal
A metric tracking the socioeconomic signals of the area.
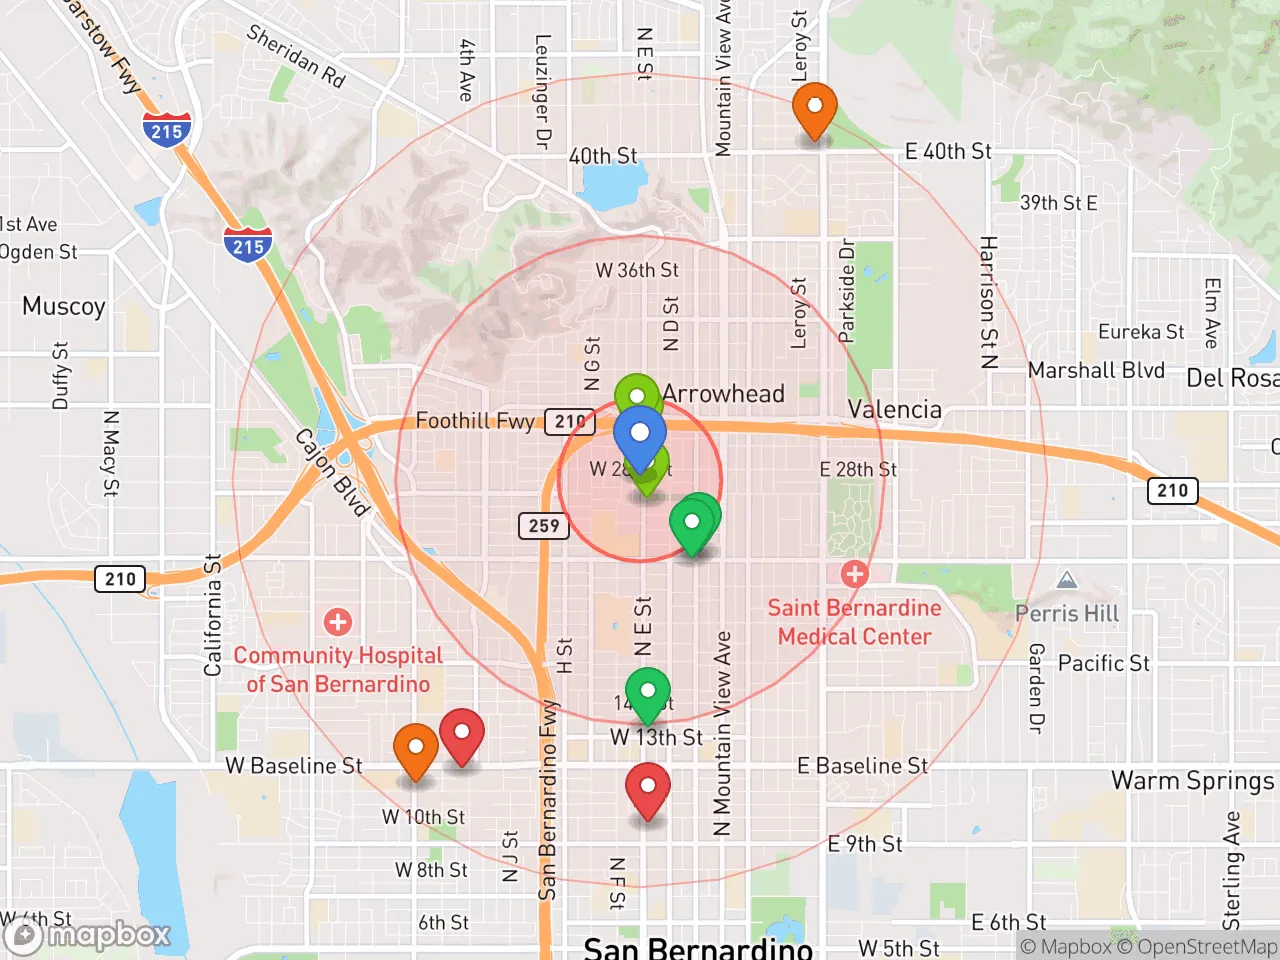
Hobbies
Explore the areaGroceries
7 within 10 miles
Gas
20 within 10 miles
Hospital
20 within 20 miles
Airport
SAN — San Bernardino International
Post Office
USPS — San Bernardino, CA
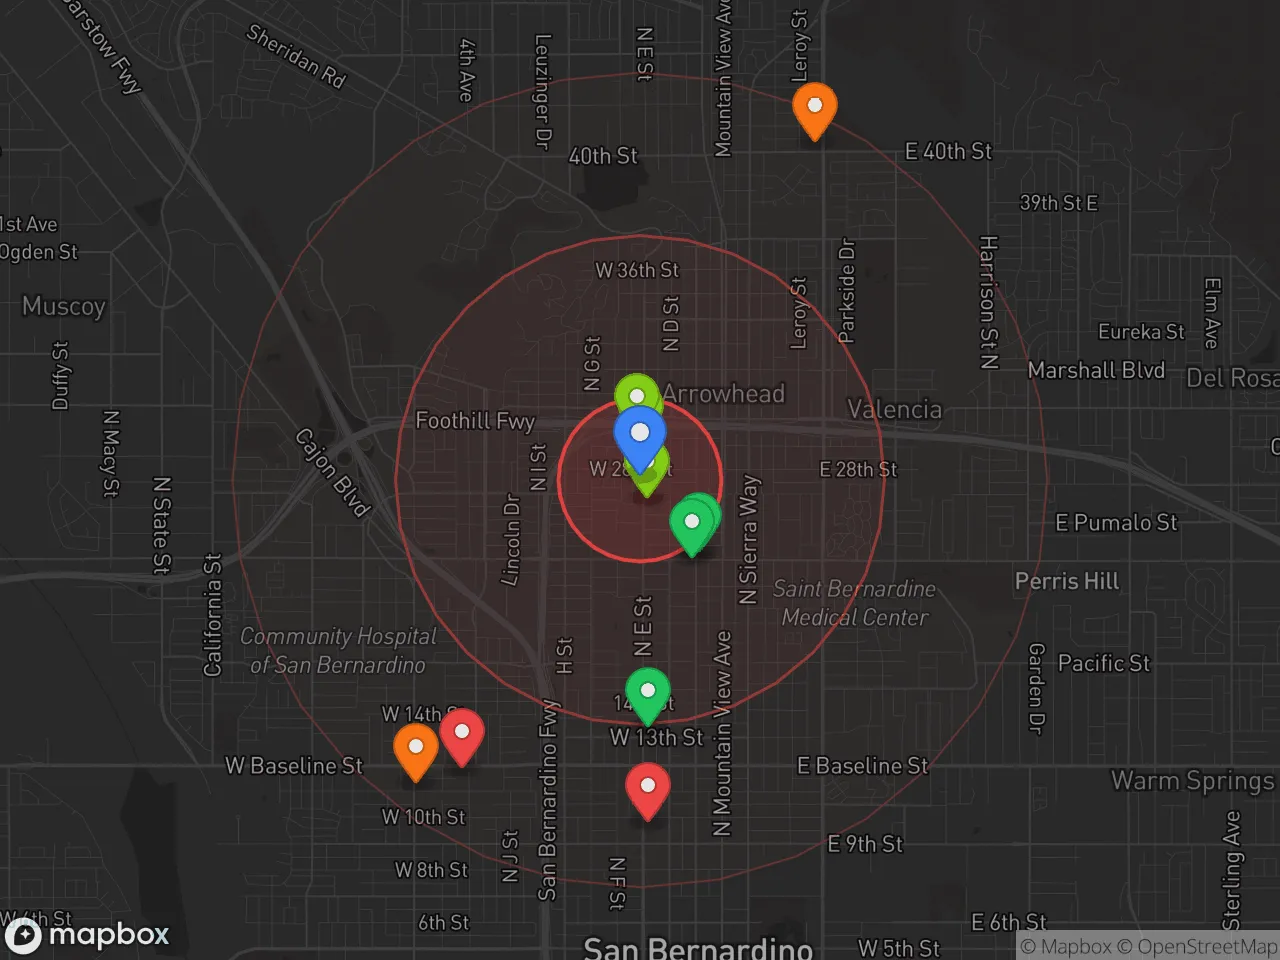
Critical Amenities
Quality-of-Life Analysis
San Bernardino, California, presents a quality-of-life profile that is distinctly more affordable than much of Southern California, yet it remains a city of contrasts where residents navigate higher costs than the national average alongside significant economic challenges. With a cost-of-living index of 129 (100 = U.S. average), the city is 29% more expensive than the typical American locale, but it is a relative bargain compared to neighboring Los Angeles (index ~150) or Orange County (index ~140). The population is predominantly working- and middle-class, with a large share of families, long-term renters, and commuters who trade higher housing affordability for longer travel times. While San Bernardino lacks the affluence of coastal enclaves, it offers a grounded, community-oriented lifestyle for those who prioritize space and lower housing costs over proximity to high-end amenities.
Cost of living, housing affordability, and how San Bernardino compares to nearby cities
San Bernardino’s housing market is the primary driver of its relative affordability. The median home value of $384,900 is roughly half that of Los Angeles County ($750,000+) and about 40% less than the Inland Empire average ($450,000). Renters also benefit: the median rent of $1,433 is significantly below the regional average of $1,800, making it one of the most accessible rental markets in Southern California for households earning under $60,000 annually. However, the cost-of-living index of 129 means groceries, utilities, and transportation are all above the national baseline. The average commute of 28.7 minutes is slightly longer than the national average (26 minutes) but shorter than commutes from more distant Inland Empire suburbs like Temecula (35+ minutes). Many residents work in logistics, healthcare, or retail within San Bernardino or commute to Ontario, Riverside, or even Los Angeles via I-10 or the Metrolink rail line. For buyers, property taxes are capped at roughly 1.1% of purchase price under Proposition 13, keeping long-term ownership costs predictable.
Schools, amenities, and what daily life is like for families and commuters
Daily life in San Bernardino is shaped by its role as a regional hub for services and transportation. The San Bernardino City Unified School District serves over 46,000 students, with several schools offering magnet and dual-language programs, though overall academic performance lags behind state averages. Families often supplement with charter options like the San Bernardino School of the Arts or commute to nearby districts in Redlands or Highland. Amenities are practical rather than upscale: the city has over 30 parks, including the 1,500-acre San Bernardino National Forest trailhead, and the Inland Center Mall provides retail anchors. The downtown area has seen revitalization efforts, including the San Bernardino Transit Center and the new California Theatre restoration, but nightlife and dining options remain limited compared to Riverside or Claremont. The rhythm of life is car-dependent, with most errands requiring a drive, though the Metrolink station connects commuters to Los Angeles Union Station in about 90 minutes. Healthcare access is solid, with Dignity Health’s St. Bernardine Medical Center and Arrowhead Regional Medical Center serving the area.
Who thrives in San Bernardino? The city is best suited for budget-conscious families, first-time homebuyers, and long-distance commuters who need a lower-cost base within striking distance of the Los Angeles and Orange County job markets. Retirees on fixed incomes may find the housing affordable but should weigh the higher crime rates and limited cultural amenities. Professionals in logistics, healthcare, or education will appreciate the local employment base, while those seeking vibrant urban energy or top-tier schools will likely prefer pricier alternatives like Redlands or Irvine. San Bernardino offers a trade-off: tangible affordability in exchange for compromises on convenience, safety, and polish.
Crime in San Bernardino, CA
WARNING: The crime statistics are unreliable for this jurisdiction. Local authorities have either not reported or under reported their data to the FBI. This could be due to bad intentions, incompetence or technical issues. Regardless, we suggest skepticism.
Significantly higher crime rates than 75% of comparable U.S. locations.
Violent CrimeViolent Crime Analysis
Property CrimeProperty Crime Analysis
Crime Analysis
San Bernardino, California, reports a violent crime rate of 547.4 incidents per 100,000 residents and a property crime rate of 1,399.4 per 100,000, placing it among the higher-risk cities in the Inland Empire. These figures reflect a community grappling with systemic challenges, including a justice system influenced by progressive policies that prioritize offender rehabilitation over public safety. For potential residents, understanding these numbers in context is essential, as they indicate a heightened likelihood of encountering both violent and property crimes compared to safer suburban alternatives.
Crime in context
San Bernardino’s violent crime rate is nearly 1.5 times the California state average and roughly 2.5 times the national median, according to FBI data. Property crime, while slightly below some neighboring cities like Riverside, remains elevated due to factors such as poverty, gang activity, and a justice system that many critics argue is too lenient. The city’s proximity to Los Angeles and its role as a regional transportation hub contribute to transient crime, but the core issue is a local legal environment where progressive district attorneys and judges often favor reduced sentencing and diversion programs. This approach, while well-intentioned, has been linked to higher recidivism rates and a perception that criminals face few consequences, directly undermining community safety.
What residents experience
Daily life for San Bernardino residents involves navigating a landscape where property crimes like vehicle theft, burglary, and vandalism are common, and violent incidents—including aggravated assault and robbery—occur with unsettling frequency. Police response times average 12-15 minutes in non-emergency situations, and clearance rates for property crimes hover around 10%, meaning most offenders are never caught. The progressive judicial philosophy in San Bernardino County, which emphasizes restorative justice and alternatives to incarceration, has resulted in over 40% of felony arrests being diverted or dismissed before trial, according to local court data. For victims, this translates to a system that often prioritizes the rights of the accused over their own, creating a cycle where repeat offenders remain on the streets.
Neighborhood-level variation
Safety varies significantly by neighborhood. Areas like the North End near California State University, San Bernardino, and the Verdemont community report lower crime rates, with violent incidents roughly half the city average. In contrast, the Westside, downtown corridor, and areas around the San Bernardino Transit Center experience violent crime rates exceeding 800 per 100,000, driven by gang activity and open drug markets. Gated communities and newer developments in the eastern foothills offer relative safety, but even these pockets are affected by the city’s overall high property crime. Prospective residents should prioritize neighborhoods with active neighborhood watch programs and consider that the city’s progressive legal climate means even low-crime areas are not immune to spillover from adjacent high-crime zones.
* Values derived from national, state, county, city and local statistics and may differ in a specific area. Last updated: 2026-04-24T09:08:44.000Z
Narrative content on this page is AI-generated and may contain mistakes. Verify any details that matter before acting on them.
ReloMaps may earn a commission from affiliate links at no extra cost to you.