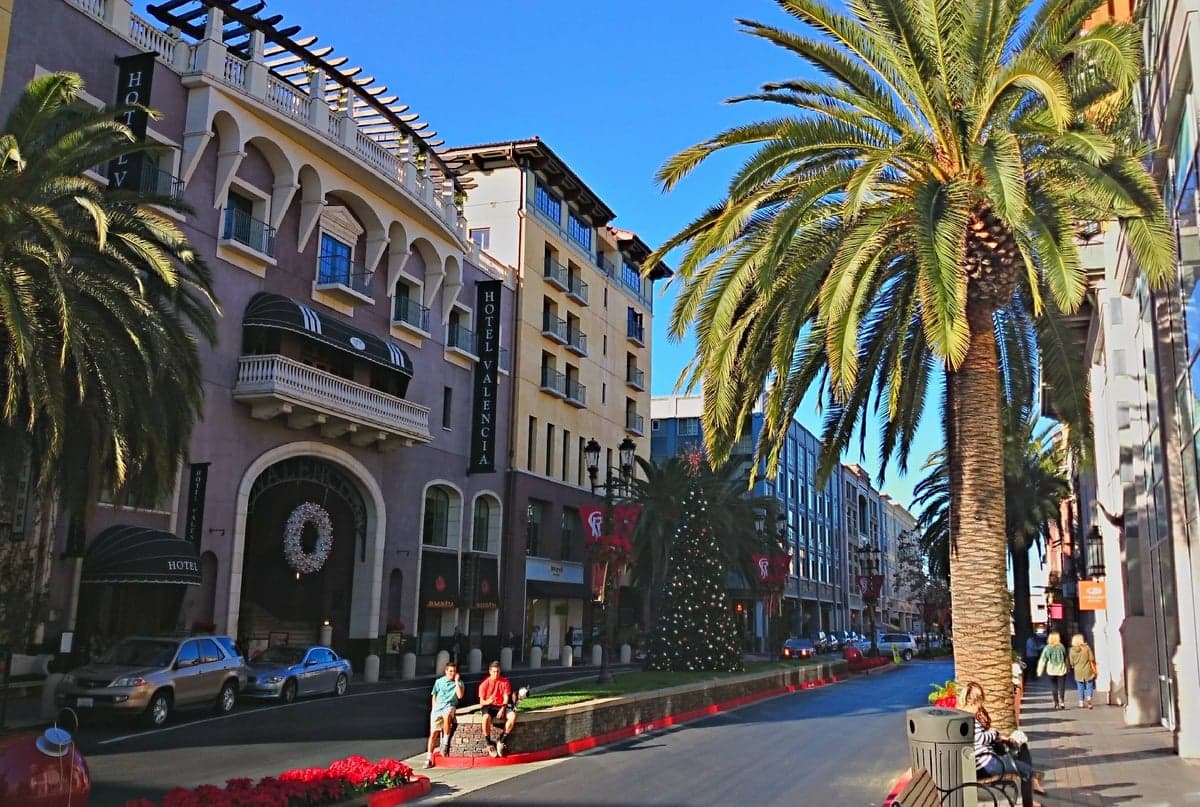
Photo: Wikipedia
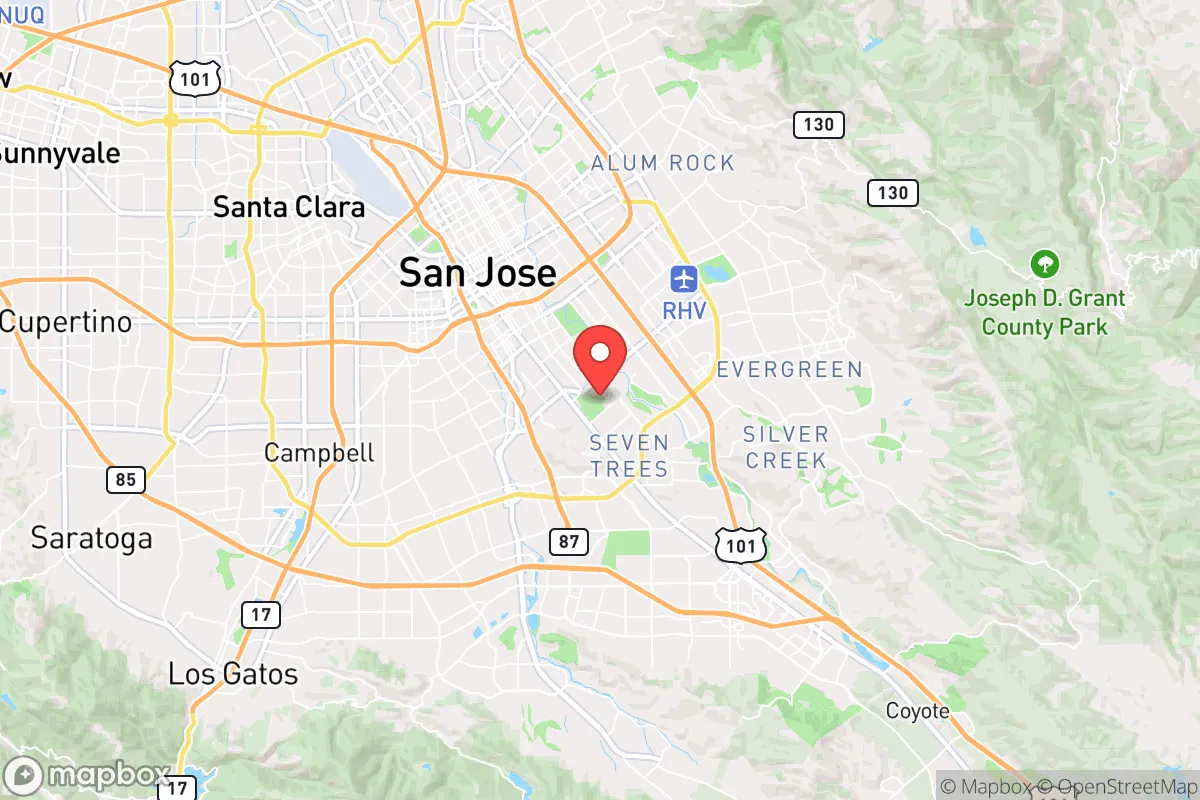
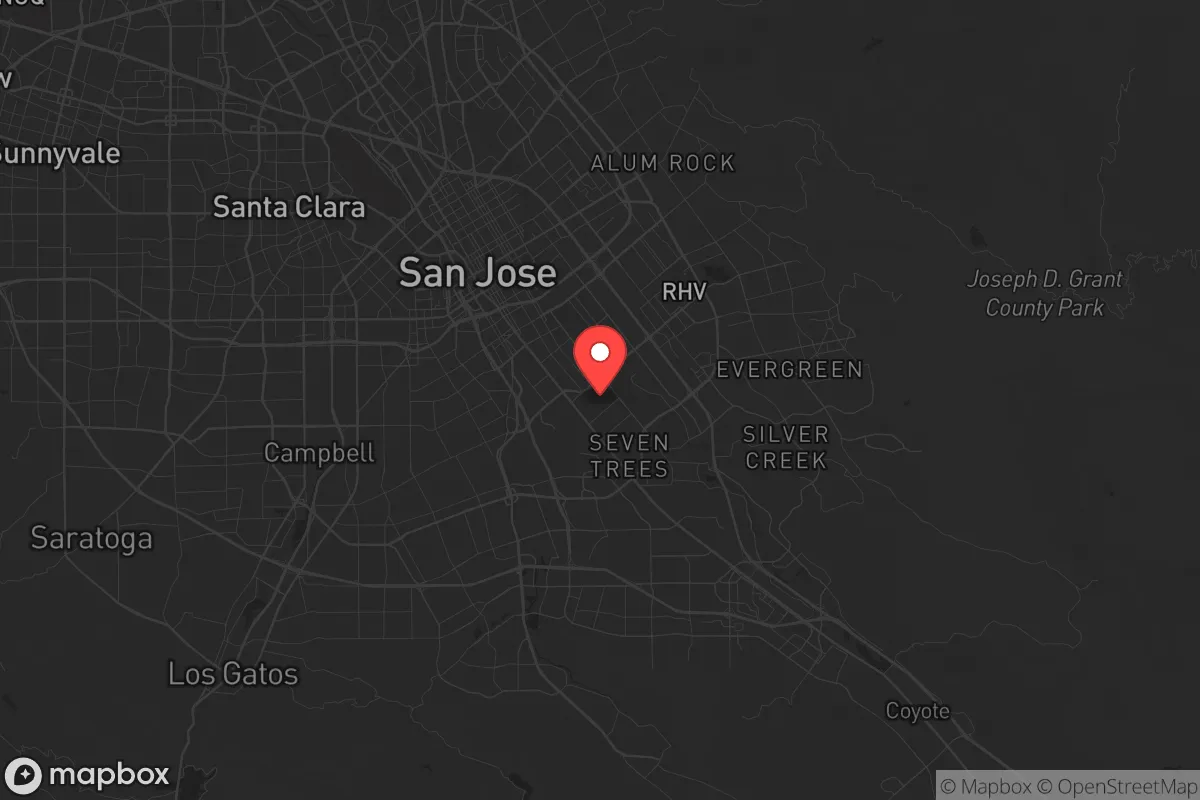
Demographics of San Jose, CA
Affluence Level in San Jose, CA
An upper-middle-class area. Household wealth, education levels, and homeownership run ahead of national benchmarks.
People of San Jose, CA
San Jose is a majority-minority city of nearly one million residents, defined by its large East and Southeast Asian population (30.2%) and Hispanic community (31.0%), with a significant Indian-subcontinent population (8.2%) and a white population of just 23.2%. It is the most ethnically diverse major city in the Bay Area, yet it remains highly segregated by neighborhood and income, creating a patchwork of distinct ethnic enclaves rather than a fully integrated melting pot. The city’s identity is shaped by its dual role as a blue-collar agricultural hub turned tech-engineered suburb, where high housing costs and a 46.5% college-educated workforce coexist with a substantial working-class immigrant base.
How the city was settled and grew
San Jose’s population history begins with the Spanish pueblo founded in 1777, the first civilian settlement in California, drawing Mexican and Spanish settlers to farm the fertile Santa Clara Valley. After the U.S. annexation in 1848, the city grew slowly as an agricultural center, with Italian, Portuguese, and German immigrants arriving to work orchards and canneries. The first major non-European wave came with Chinese laborers in the 1860s-1880s, who built the railroad and then worked as farmhands, settling in what is now the Heinlenville neighborhood (near modern Japantown) before being forcibly displaced by anti-Chinese violence. Japanese immigrants followed in the early 1900s, establishing the Japantown district as a commercial and residential hub, one of only three surviving Japantowns in the U.S. By 1940, San Jose was still a small city of 68,000, overwhelmingly white and Hispanic, with a tiny Asian minority.
Modern era (post-1965)
The 1965 Hart-Cellar Immigration Act and the rise of Silicon Valley transformed San Jose’s population. Vietnamese refugees arrived after 1975, clustering in Little Saigon along Story Road and Tully Road in the city’s eastern neighborhoods, creating the largest Vietnamese community in the Bay Area. Filipino immigrants, drawn by healthcare and tech jobs, settled in South San Jose and the Evergreen district. Chinese and Taiwanese immigrants, many arriving as engineers after the 1980s, concentrated in Cupertino-adjacent West San Jose and the Berryessa area. Indian-subcontinent immigrants—primarily Indian engineers and their families—arrived in large numbers from the 1990s onward, settling in North San Jose and the Milpitas border area, where new high-density housing developments catered to tech workers. Meanwhile, the Hispanic population, historically Mexican-American, grew through both immigration and higher birth rates, spreading across the East Side (Alum Rock, Mayfair) and downtown’s Washington-Guadalupe neighborhood. The white population, once a majority, declined from 65% in 1970 to 23.2% today, as many white families moved to outlying suburbs like Morgan Hill or Gilroy. The city’s foreign-born share stands at 18.2%, lower than San Francisco (34%) but significant, with Vietnam, Mexico, India, the Philippines, and China as the top countries of origin.
The future
San Jose’s population is heading toward further diversification, but with increasing economic and ethnic balkanization. The East and Southeast Asian population (30.2%) is plateauing as immigration from Vietnam and China slows, while the Indian-subcontinent population (8.2%) continues to grow rapidly, driven by H-1B tech workers and their families, who are settling in new high-rise developments in Downtown San Jose and North San Jose. The Hispanic population (31.0%) is growing through natural increase and is projected to become the largest single group within 10-15 years, though it remains concentrated in lower-income neighborhoods with lower college attainment rates. The white population is stabilizing after decades of decline, as some affluent white professionals move into revitalized downtown lofts and the Willow Glen historic district. The city is not homogenizing; instead, it is tribalizing into distinct enclaves by ethnicity and income, with little cross-neighborhood mixing. The next 20 years will likely see continued growth in the Indian and Hispanic shares, a stable Asian share, and a slowly shrinking white share, with the city becoming a patchwork of tech-worker enclaves (Indian, Chinese, white) and working-class Hispanic neighborhoods.
For a conservative-leaning mover, San Jose offers a high-cost, high-opportunity environment where neighborhood choice is the primary determinant of daily life. The city is not a single community but a federation of ethnic and economic zones, each with its own schools, churches, and social networks. New arrivals should expect to live among people of similar background and income, with limited interaction across enclaves, and should budget accordingly for the premium placed on safe, well-ranked school districts like those in Berryessa or Evergreen.
* Values derived from national, state, county, city and local statistics and may differ in a specific area. Last updated: 2026-04-24T06:53:40.000Z
Narrative content on this page is AI-generated and may contain mistakes. Verify any details that matter before acting on them.
ReloMaps may earn a commission from affiliate links at no extra cost to you.