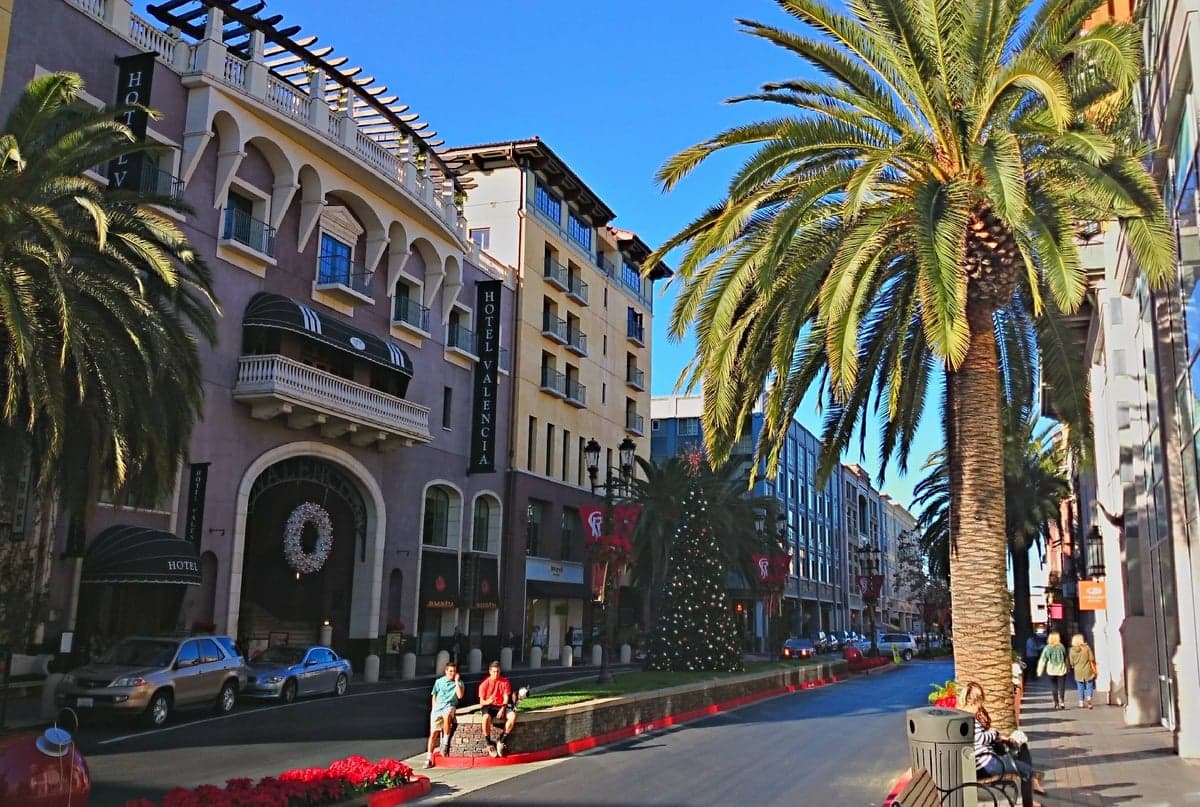
Photo: Wikipedia
Quality of Life in San Jose, CA
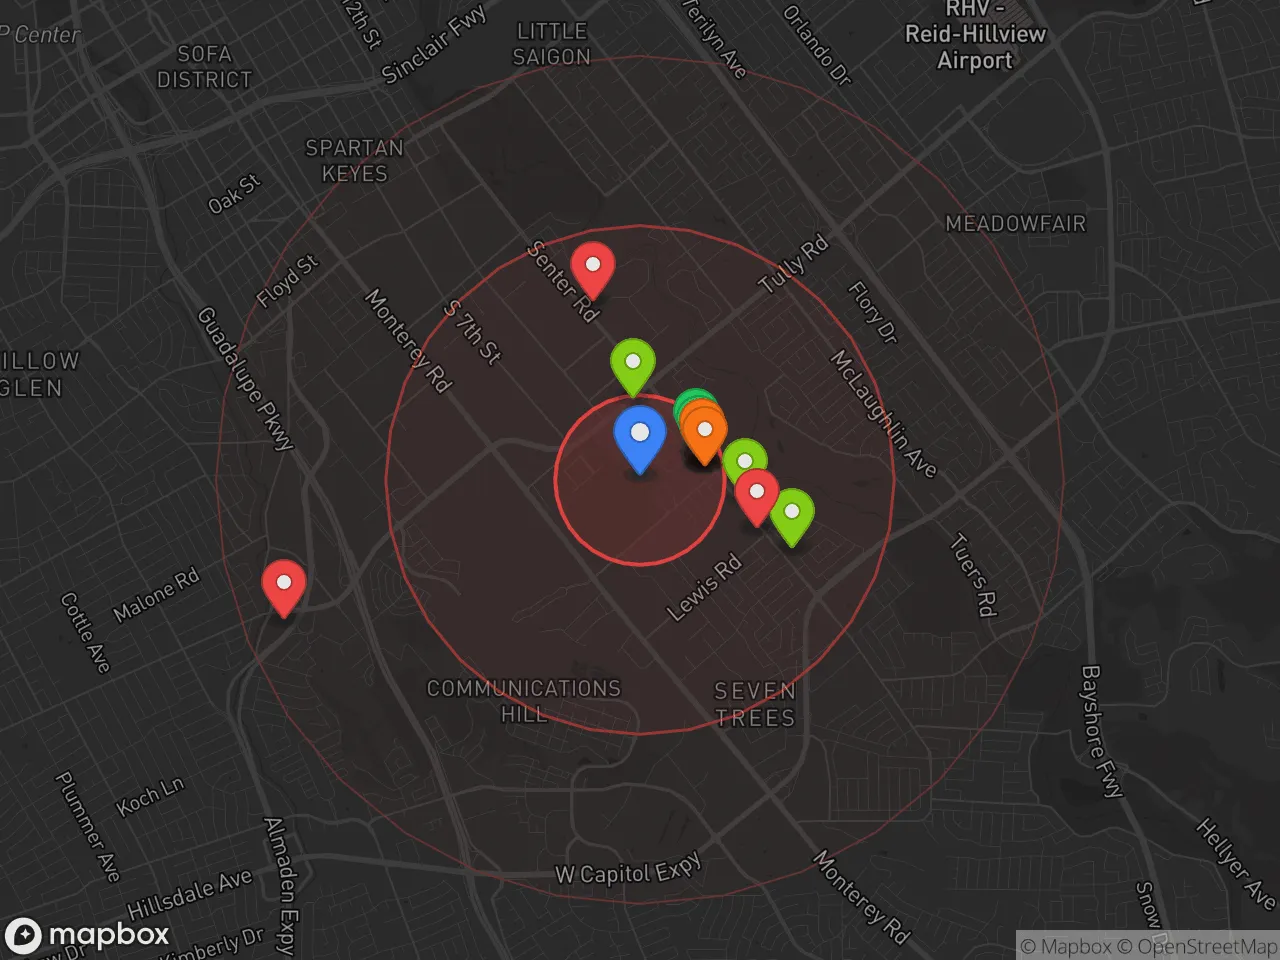
Above-average quality of iife. The area offers a reasonable cost of living, decent mobility, and a mix of neighborhood amenities.
What does Quality of Life tell us?
Quality of Life blends cost of living, nearby amenities, socioeconomic signals, and neighborhood character. City-level scores represent the whole municipality; individual neighborhoods can differ.
What does this tell us?
Quality of Life blends cost of living, nearby amenities, socioeconomic signals, and neighborhood character. City-level scores represent the whole municipality; individual neighborhoods can differ.
Cost of Living
204% above national average
The Real Cost of Living in San Jose, CA for 2026
| Tier | Individual | Family (4) |
|---|---|---|
| Survival | $42k | $79k |
| Comfortable | $173k | $254k |
| Luxury | $253k+ | $392k+ |
| Elite (Top 5%) | $298k+ | $462k+ |
56%
The Area Signal
A metric tracking the socioeconomic signals of the area.
Hobbies
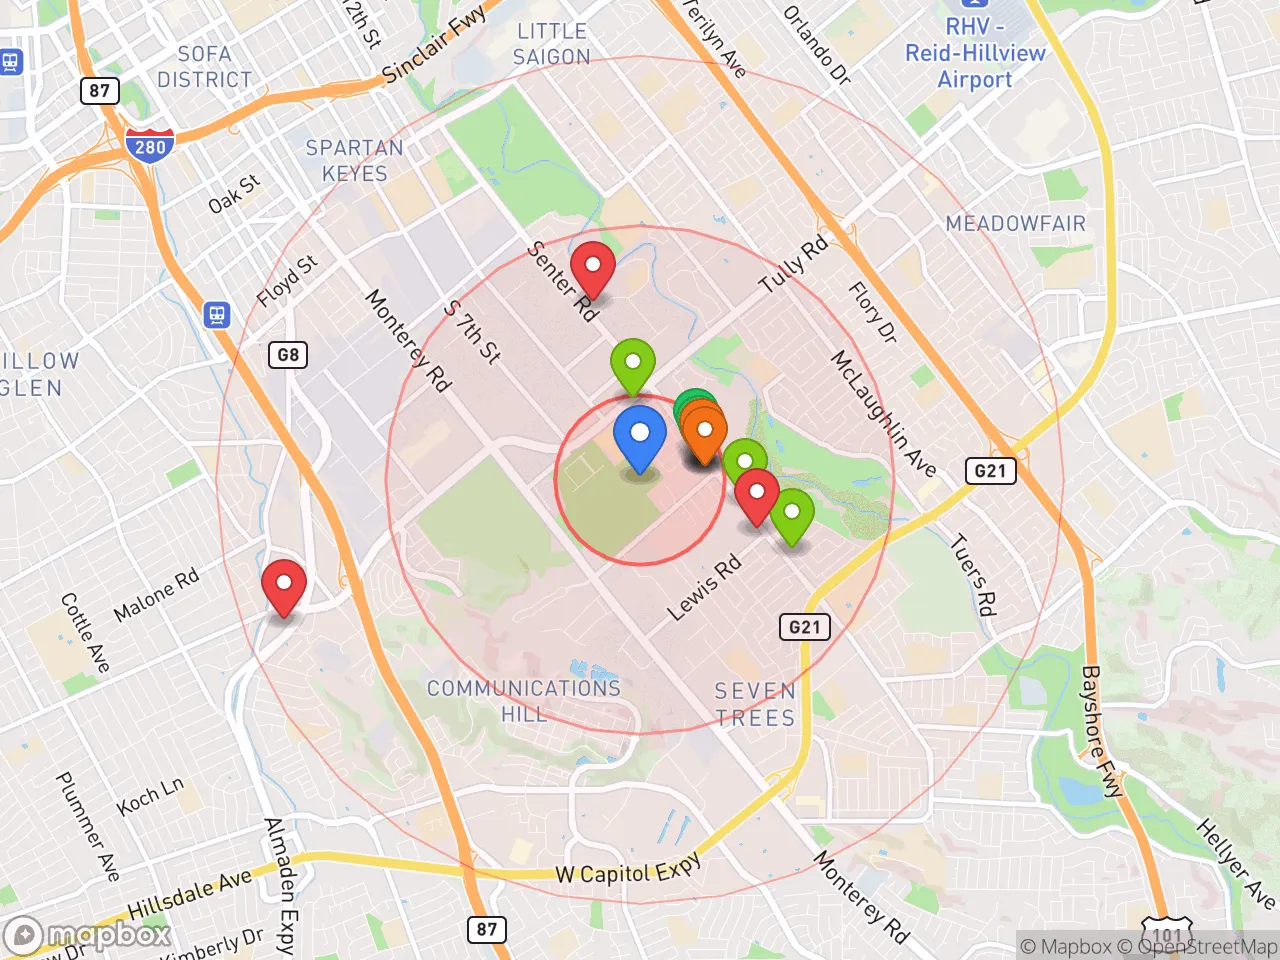
Explore the areaGroceries
8 within 10 miles
Gas
20 within 10 miles
Hospital
20 within 20 miles
Airport
SJC — San Jose International
Post Office
USPS — 80 Lewis Road, San
Critical Amenities
Quality-of-Life Analysis
San Jose, the largest city in Silicon Valley and the third-largest in California, anchors a region defined by extreme affluence and a highly educated, tech-driven population. With a cost of living index of 304 (more than three times the national average), the city is home to a workforce dominated by engineers, executives, and knowledge workers employed by global giants like Apple, Google, Cisco, and Adobe. This economic concentration creates a unique quality of life where high incomes coexist with some of the nation’s most challenging housing costs and a fast-paced, career-focused daily rhythm.
Cost of living, housing affordability, and how San Jose compares to nearby cities
San Jose’s cost of living is the primary barrier for most newcomers, driven almost entirely by housing. The median home value sits at $1,187,800, while the median rent for a typical apartment is $2,617 per month. These figures are significantly higher than national averages but are actually slightly lower than in neighboring San Francisco (where median rent often exceeds $3,000) and comparable to Palo Alto and Mountain View. However, San Jose offers more square footage for the price than its Peninsula neighbors. The average one-way commute in San Jose is 28.1 minutes, which is shorter than the San Francisco average (over 30 minutes) but still reflects the region’s notorious traffic congestion on highways like US-101 and I-280. For context, a household earning the local median income of roughly $125,000 would still spend over 30% of gross income on housing—a threshold that defines “cost-burdened” renters. The city’s Rent Stabilization Ordinance caps annual rent increases for older units (built before 1979) at 5% plus local CPI, offering some protection for long-term tenants.
What daily life is like: amenities, schools, and the local rhythm
Daily life in San Jose balances suburban sprawl with urban density. The city boasts over 200 parks, including the expansive Almaden Quicksilver County Park and the family-friendly Guadalupe River Trail. The San José Museum of Art and the Tech Interactive (a hands-on science center) anchor the downtown cultural scene, while the San Jose Sharks NHL team provides year-round sports entertainment at the SAP Center. For families, the San José Unified School District is highly rated, with several schools—such as Leland High School and Bret Harte Middle School—consistently ranking among California’s top 10%. The city’s rhythm is notably career-centric: many residents work long hours in tech, with evenings often spent at networking events, fitness classes, or dining in the diverse Japantown or Willow Glen neighborhoods. The VTA light rail and Caltrain provide commuter rail options, though most residents still rely on cars for errands and weekend trips to the Santa Cruz Mountains or Monterey Bay.
San Jose is best suited for tech professionals, dual-income families, and career-focused individuals who can command salaries that offset the high cost of living. It is less ideal for retirees on fixed incomes, entry-level workers, or those seeking a slower, more affordable lifestyle. The city offers a high baseline of safety, excellent public schools, and abundant outdoor recreation, but the financial pressure of housing means that many residents prioritize career advancement over leisure. For those who can afford the entry price, San Jose provides a stable, opportunity-rich environment that few other U.S. cities can match.
Crime in San Jose, CA
WARNING: The crime statistics are unreliable for this jurisdiction. Local authorities have either not reported or under reported their data to the FBI. This could be due to bad intentions, incompetence or technical issues. Regardless, we suggest skepticism.
Significantly higher crime rates than 75% of comparable U.S. locations.
Violent CrimeViolent Crime Analysis
Property CrimeProperty Crime Analysis
Crime Analysis
San Jose, California, presents a complex safety landscape where property crime rates significantly exceed national averages, while violent crime, though elevated, remains below the rates seen in many comparably sized U.S. cities. With a violent crime rate of 504.3 incidents per 100,000 residents and a property crime rate of 2,386.9 per 100,000, the city’s overall risk profile is shaped by both its dense urban environment and the broader criminal justice policies of Santa Clara County. Prospective residents should weigh these statistics carefully, particularly given the local judicial climate.
Crime in context
San Jose’s violent crime rate is roughly 30% higher than the national average but notably lower than in nearby San Francisco or Oakland. Property crime, however, is a more pressing concern: the city’s rate is approximately 40% above the U.S. average. These figures place San Jose in a middle tier among large California metros. A critical factor driving these numbers is the progressive prosecutorial and judicial approach in Santa Clara County. District Attorney Jeff Rosen and local judges have implemented policies emphasizing diversion programs, reduced cash bail, and sentence reductions for non-violent offenses. While intended to reduce incarceration, these policies have been linked to higher recidivism and a perception that property crimes—such as auto theft, shoplifting, and burglary—carry minimal consequences. This environment directly contributes to more criminals remaining on the street, undermining public safety and victim justice.
What residents experience
Daily life for San Jose residents involves a heightened vigilance against property crime. Car break-ins and catalytic converter thefts are endemic, particularly in shopping center parking lots and near downtown. Package theft from porches is a routine nuisance. Violent crime, while less frequent, is concentrated in specific areas: gang-related incidents and aggravated assaults occur disproportionately in East San Jose and parts of the downtown core. Residents report that the combination of high property crime and a lenient justice system creates a sense of impunity among offenders. For example, a 2024 report by the San Jose Police Department noted that over 60% of property crime arrestees had prior records, many with multiple open cases—a direct consequence of progressive policies that prioritize release over detention.
Neighborhood-level safety varies dramatically. Affluent areas like Willow Glen, Almaden Valley, and Cambrian Park experience significantly lower crime rates, with violent crime often below 200 per 100,000 and property crime roughly half the city average. In contrast, neighborhoods such as Downtown, East San Jose, and South San Jose near the Monterey Highway corridor see rates double or triple those figures. The disparity is driven by socioeconomic factors and policing resources, but the overarching judicial philosophy applies citywide. For families and professionals, choosing a neighborhood with strong neighborhood watch programs and private security measures is essential. Ultimately, San Jose’s safety profile is one of manageable violent crime but persistent, policy-exacerbated property crime that demands proactive personal security habits.
* Values derived from national, state, county, city and local statistics and may differ in a specific area. Last updated: 2026-04-24T06:53:40.000Z
Narrative content on this page is AI-generated and may contain mistakes. Verify any details that matter before acting on them.
ReloMaps may earn a commission from affiliate links at no extra cost to you.