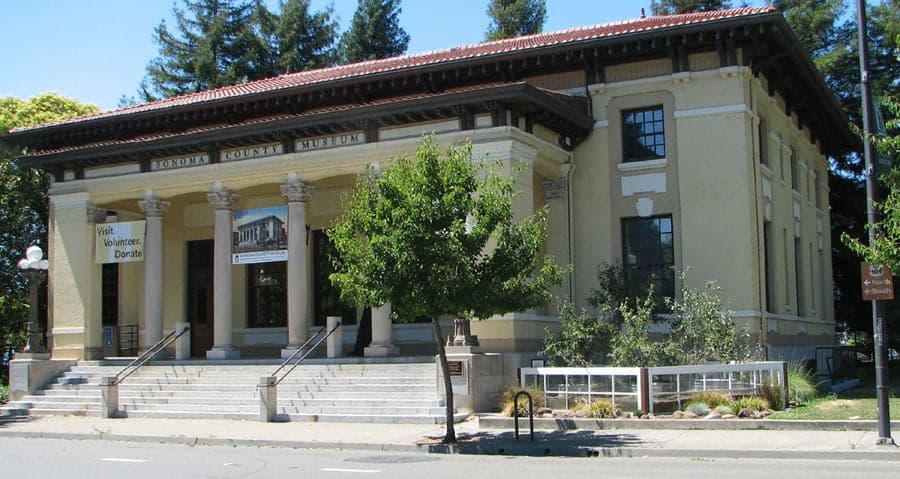
Photo: Wikipedia
Quality of Life in Santa Rosa, CA
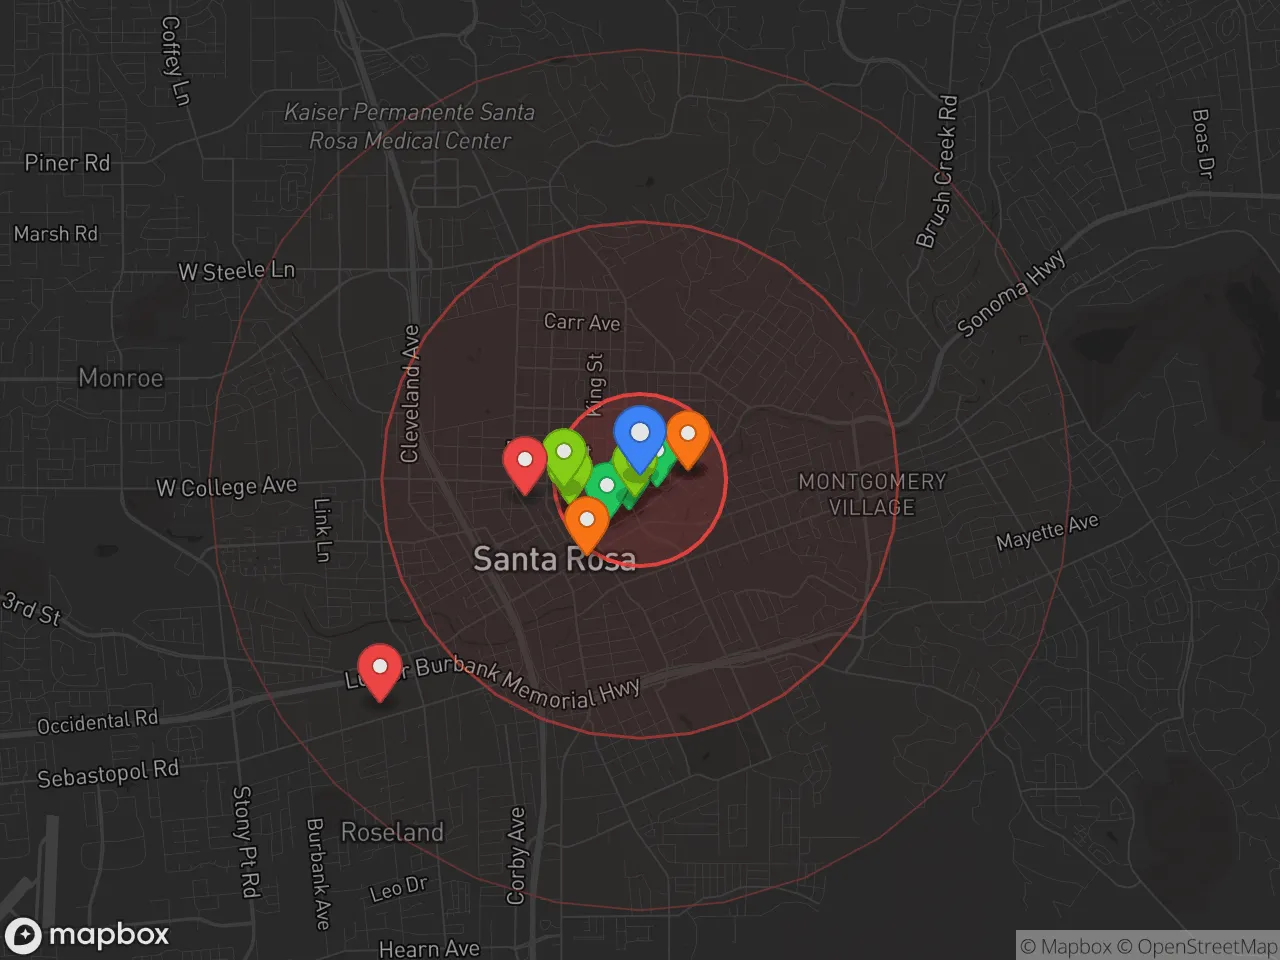
A high quality of life with strong walkability, manageable living costs, healthy neighborhood signals, and solid amenity access.
What does Quality of Life tell us?
Quality of Life blends cost of living, nearby amenities, socioeconomic signals, and neighborhood character. City-level scores represent the whole municipality; individual neighborhoods can differ.
What does this tell us?
Quality of Life blends cost of living, nearby amenities, socioeconomic signals, and neighborhood character. City-level scores represent the whole municipality; individual neighborhoods can differ.
Cost of Living
105% above national average
The Real Cost of Living in Santa Rosa, CA for 2026
| Tier | Individual | Family (4) |
|---|---|---|
| Survival | $33k | $63k |
| Comfortable | $118k | $174k |
| Luxury | $173k+ | $268k+ |
| Elite (Top 5%) | $204k+ | $316k+ |
56%
The Area Signal
A metric tracking the socioeconomic signals of the area.
Hobbies
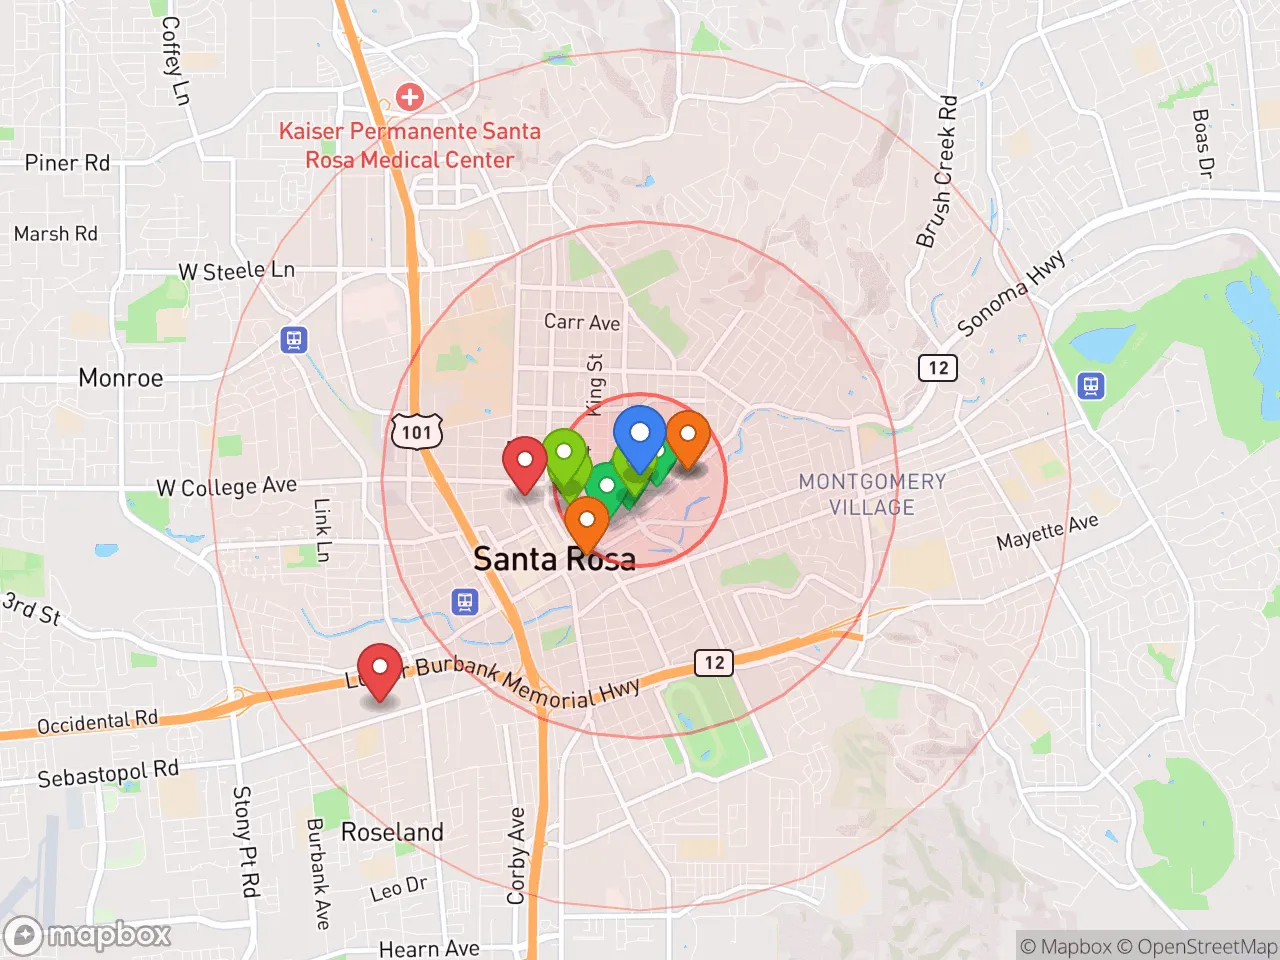
Explore the areaGroceries
6 within 10 miles
Gas
20 within 10 miles
Hospital
12 within 20 miles
Airport
SAN — Oakland San Francisco Bay
Post Office
USPS — Santa Rosa, CA
Critical Amenities
Quality-of-Life Analysis
Santa Rosa, California, presents a quality of life defined by its position as the largest city in Sonoma County, attracting a mix of affluent professionals, wine-country workers, and families seeking a balance between natural beauty and urban convenience. The city’s population of roughly 178,000 includes a significant number of commuters to San Francisco and the North Bay tech corridor, alongside a strong local workforce in healthcare, hospitality, and agriculture. While the area’s reputation for wine-country living suggests a certain affluence, the reality is a more economically diverse community where high costs and a relatively high median income coexist.
Cost of living, housing, and affordability compared to San Francisco and Petaluma
Santa Rosa’s cost of living index of 205—more than double the national average—is a defining factor for residents, though it remains notably cheaper than San Francisco (index ~269) and comparable to nearby Petaluma. The median home value of $685,000 is significantly lower than the Bay Area median of over $1.2 million, making it one of the more attainable entry points for homeownership in the region. However, this figure still requires a household income well above $150,000 for a conventional mortgage. Renters face a median rent of $2,084, which is about 15% below the San Francisco average but still consumes a large share of income for many service workers. The average commute of 22.6 minutes is notably shorter than the 35+ minute averages seen in Marin or San Francisco, a practical advantage for those working locally in Santa Rosa’s hospitals, schools, or the growing tech-adjacent sector. For residents willing to accept a longer drive, the trade-off is access to more affordable housing than in Sonoma or Healdsburg, where median prices often exceed $800,000.
What daily life is like for families: schools, parks, and local amenities
Daily life in Santa Rosa revolves around a mix of suburban convenience and outdoor access. The city is served by the Santa Rosa City Schools district, which includes several well-regarded elementary schools like Proctor Terrace and Steele Lane, though high school performance varies and many families consider private options such as Cardinal Newman or Ursuline College Preparatory. The city’s over 40 parks, including the expansive Howarth Park with its train and lake, and the 155-acre Spring Lake Regional Park, provide ample recreation for families and dog owners. The downtown area, rebuilt after the 2017 Tubbs Fire, now features a revitalized Railroad Square with breweries, the historic Luther Burbank Center for the Arts, and a growing number of farm-to-table restaurants. The climate is a major draw—260 sunny days per year with mild winters—enabling year-round hiking in the nearby Annadel State Park or cycling along the Joe Rodota Trail. Traffic is manageable outside of peak hours, and the SMART train provides a direct link to Larkspur and the San Francisco ferry, though most errands still require a car.
Santa Rosa is best suited for those who prioritize access to wine country, outdoor recreation, and a slower pace than the Bay Area core, but who still need reasonable proximity to urban job centers. The high cost of living and housing will challenge lower-income households, but for dual-income professionals, remote workers, or families with established equity, the trade-off of a 22-minute commute and a backyard in a climate-rich region is compelling. It is less ideal for those seeking nightlife or extreme affordability, but for the right demographic, it offers a rare blend of natural beauty, functional infrastructure, and relative value within one of the nation’s most expensive regions.
Crime in Santa Rosa, CA
Crime rates similar to the national median for U.S. locations.
Violent CrimeViolent Crime Analysis
Property CrimeProperty Crime Analysis
Crime Analysis
Santa Rosa, California, reports a violent crime rate of 289.7 incidents per 100,000 residents and a property crime rate of 1,405.8 per 100,000, placing it above national averages for both categories. While not the most dangerous city in Sonoma County, these figures reflect a community where property crime is a persistent concern and violent incidents occur at a rate roughly 20% higher than the national median. The city's safety picture is further complicated by its location within a large, liberal-leaning metropolitan area where progressive prosecutorial policies have been linked to higher recidivism and reduced consequences for property offenses.
Crime in context
Santa Rosa's violent crime rate of 289.7 per 100,000 is significantly higher than the national rate of approximately 270 per 100,000 and well above the California state average of roughly 280 per 100,000. Property crime is the more acute issue, with a rate of 1,405.8 per 100,000 that exceeds the national average by about 40%. These numbers place Santa Rosa in a challenging position: it is safer than nearby Vallejo or Oakland but notably more dangerous than smaller, more conservative Sonoma County towns like Healdsburg or Sonoma. The broader context matters here—Sonoma County's District Attorney and many local judges have pursued progressive sentencing reforms, including reduced bail requirements and diversion programs for theft and drug offenses. Critics argue these policies have directly contributed to a revolving-door justice system, where repeat property offenders are released quickly, emboldening further crime and eroding public trust in safety.
What residents experience
For residents, the most tangible daily impact is property crime. Vehicle break-ins, package theft, and catalytic converter theft are widespread, particularly in commercial corridors like Santa Rosa Avenue and near the downtown transit hub. Home burglaries are also a recurring issue in neighborhoods adjacent to Highway 101. Violent crime, while less frequent, is concentrated in specific areas—assaults and robberies are more common near the downtown core and in the Roseland neighborhood. Residents often report feeling safe in their own homes but wary of leaving vehicles or belongings unattended. The presence of homeless encampments along the Santa Rosa Creek and near the Joe Rodota Trail has also heightened concerns about trespassing and public intoxication, with many residents feeling that law enforcement lacks the backing of the justice system to take meaningful action.
Neighborhood-level variation is pronounced. Areas west of Highway 101, including the Fountaingrove and Rincon Valley neighborhoods, generally see lower crime rates and are considered safer, with more private security and community patrols. In contrast, the downtown core, the Roseland area, and parts of the South Park neighborhood experience higher rates of both property and violent crime. The city's overall safety trajectory is a growing concern for families and businesses, as the combination of high property crime and a permissive legal environment continues to challenge community confidence in long-term safety.
* Values derived from national, state, county, city and local statistics and may differ in a specific area. Last updated: 2026-04-24T11:35:09.000Z
Narrative content on this page is AI-generated and may contain mistakes. Verify any details that matter before acting on them.
ReloMaps may earn a commission from affiliate links at no extra cost to you.