

Photo: Wikipedia
Quality of Life in Somerville, MA
Above-average quality of iife. The area offers a reasonable cost of living, decent mobility, and a mix of neighborhood amenities.
What does Quality of Life tell us?
Quality of Life blends cost of living, nearby amenities, socioeconomic signals, and neighborhood character. City-level scores represent the whole municipality; individual neighborhoods can differ.
What does this tell us?
Quality of Life blends cost of living, nearby amenities, socioeconomic signals, and neighborhood character. City-level scores represent the whole municipality; individual neighborhoods can differ.
Cost of Living
155% above national average
The Real Cost of Living in Somerville, MA for 2026
| Tier | Individual | Family (4) |
|---|---|---|
| Survival | $39k | $74k |
| Comfortable | $142k | $208k |
| Luxury | $208k+ | $322k+ |
| Elite (Top 5%) | $245k+ | $379k+ |
61%
The Area Signal
A metric tracking the socioeconomic signals of the area.
Hobbies
Explore the areaGroceries
7 within 10 miles
Gas
20 within 10 miles
Hospital
20 within 20 miles
Airport
PDX — Portland International Jetport
Post Office
USPS — Somerville, MA
Critical Amenities
Quality-of-Life Analysis
Somerville, Massachusetts, is a dense, vibrant urban hub just northwest of Boston, known for its high cost of living and a population that skews young, educated, and professional. With a cost-of-living index of 255—more than two and a half times the national average—the city attracts a mix of tech workers, academics, artists, and long-term residents who value its walkability, transit access, and cultural energy over suburban space. The median home value of $899,400 and median rent of $2,468 reflect a market that is expensive even by Greater Boston standards, yet Somerville remains more accessible than neighboring Cambridge or the Back Bay, drawing those who want urban life without the highest price tags.
Cost of living, housing affordability, and how Somerville compares to Boston and Cambridge
Somerville’s cost-of-living index of 255 is driven overwhelmingly by housing, which is roughly 280% of the national average. The median home value of $899,400 is about $100,000 below Cambridge’s median and roughly $150,000 below Boston’s, making it a relative bargain for buyers who want proximity to those job centers. Median rent of $2,468 is similarly lower than Cambridge’s $2,800+ and Boston’s $3,000+, though still steep for a city where the median household income hovers around $100,000. The average commute of 30.7 minutes is shorter than the regional average, thanks to the MBTA Red Line, Green Line extension, and multiple bus routes that connect Somerville to downtown Boston in under 20 minutes. For renters and buyers alike, the trade-off is clear: you pay a premium for a 10- to 15-minute shorter commute than suburbs like Arlington or Medford, but you get less square footage and no private yard.
What daily life is like: amenities, schools, parks, and neighborhood character
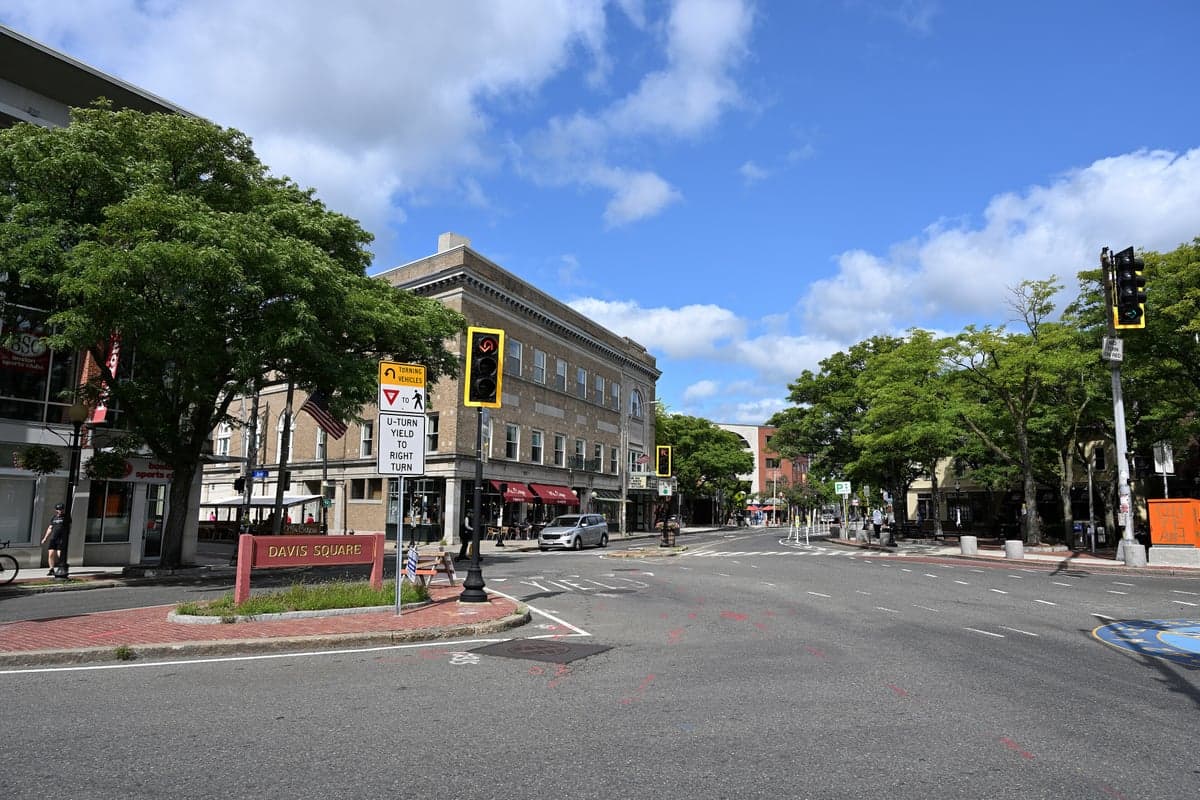
Daily life in Somerville revolves around its walkable squares—Davis, Union, and Porter—each packed with independent coffee shops, farm-to-table restaurants, and live music venues. The city’s public schools, including Somerville High School and the K-8 Arthur D. Healey School, have improved steadily over the past decade, though many families opt for nearby private or charter options. The 2024 Massachusetts Comprehensive Assessment System (MCAS) scores show Somerville schools performing slightly below state averages in English and math, but the district’s growing investment in bilingual programs and STEM tracks is drawing more families. Parks like the 7-acre Nathan Tufts Park and the newly renovated Conway Park provide green space in a city where 60% of residents live in multi-unit buildings. The rhythm is fast-paced but neighborly: weekend farmers’ markets, the annual Somerville ArtBeat festival, and a strong local business alliance keep the city feeling like a collection of small towns rather than a Boston bedroom community.
Somerville is best suited for professionals, graduate students, and young families who prioritize transit access, cultural density, and a lively street life over suburban quiet and square footage. The high cost of living filters out those on tight budgets, but for renters and buyers who can afford the median rent or home price, the payoff is a 30-minute commute to Kendall Square or downtown Boston, a thriving restaurant scene, and a community that votes overwhelmingly progressive—Somerville went 85% for Biden in 2020. Retirees seeking peace and large yards will find better value in Medford or Arlington, while anyone who wants a true urban core with lower prices than Cambridge will feel right at home here.
Crime in Somerville, MA
Lower crime rates than 76% of comparable U.S. locations.
Violent CrimeViolent Crime Analysis
Property CrimeProperty Crime Analysis
Crime Analysis
Somerville, Massachusetts, presents a complex safety picture where property crime rates significantly exceed national averages, while violent crime remains below the U.S. norm. The city's 2023 reported violent crime rate of 178.7 incidents per 100,000 residents is roughly half the national average, but its property crime rate of 1,449.2 per 100,000 is notably higher than both the Massachusetts state average and the U.S. figure. As a densely populated urban hub adjacent to Boston, Somerville's crime dynamics are shaped by its transit accessibility, dense housing stock, and the broader criminal justice policies of Middlesex County and Massachusetts.
Crime in context
When compared to state and national benchmarks, Somerville's violent crime rate is a relative bright spot, sitting well below the U.S. average of approximately 380 per 100,000. However, the property crime rate is a clear concern, exceeding the national average of roughly 1,954 per 100,000 by a smaller margin but still representing a tangible risk for residents. The city's location within a large, liberal-leaning metropolitan area is a critical factor. Middlesex County and Massachusetts as a whole have adopted progressive prosecutorial and judicial philosophies, including district attorneys who emphasize diversion programs, reduced cash bail, and alternatives to incarceration. While these policies aim to address systemic inequities, they have a direct and negative consequence: more offenders remain on the street, increasing the likelihood of repeat property crimes and reducing the deterrent effect of the justice system. This ideological approach, sympathetic to offenders, undermines public safety and justice for victims.
What residents experience
For Somerville residents, the most common safety concerns revolve around property crime. Bicycle theft, package theft from porches, and break-ins to parked cars are frequent complaints, particularly in high-density neighborhoods like Davis Square, Union Square, and Porter Square. Violent crime, while less common, is not absent; incidents tend to be concentrated in specific areas and often involve disputes among individuals known to each other rather than random attacks. The presence of progressive district attorneys means that even when arrests are made, prosecution and sentencing may be lenient, leading to a perception among many residents that the system does not adequately hold offenders accountable. This can erode trust in law enforcement and create a sense that reporting crime is futile, especially for lower-level property offenses.
Neighborhood-level variation is notable. Areas closer to the Cambridge and Boston borders, such as East Somerville and Winter Hill, tend to report higher concentrations of both property and violent crime, partly due to higher population density and foot traffic. More residential, quieter pockets like the Spring Hill neighborhood generally see lower crime rates. Regardless of location, the overarching influence of progressive criminal justice policies means that Somerville residents should be aware that the legal environment prioritizes offender rehabilitation over punitive measures, a trade-off that directly impacts community safety and victim satisfaction.
* Values derived from national, state, county, city and local statistics and may differ in a specific area. Last updated: 2026-05-01T07:51:02.000Z
Narrative content on this page is AI-generated and may contain mistakes. Verify any details that matter before acting on them.
ReloMaps may earn a commission from affiliate links at no extra cost to you.