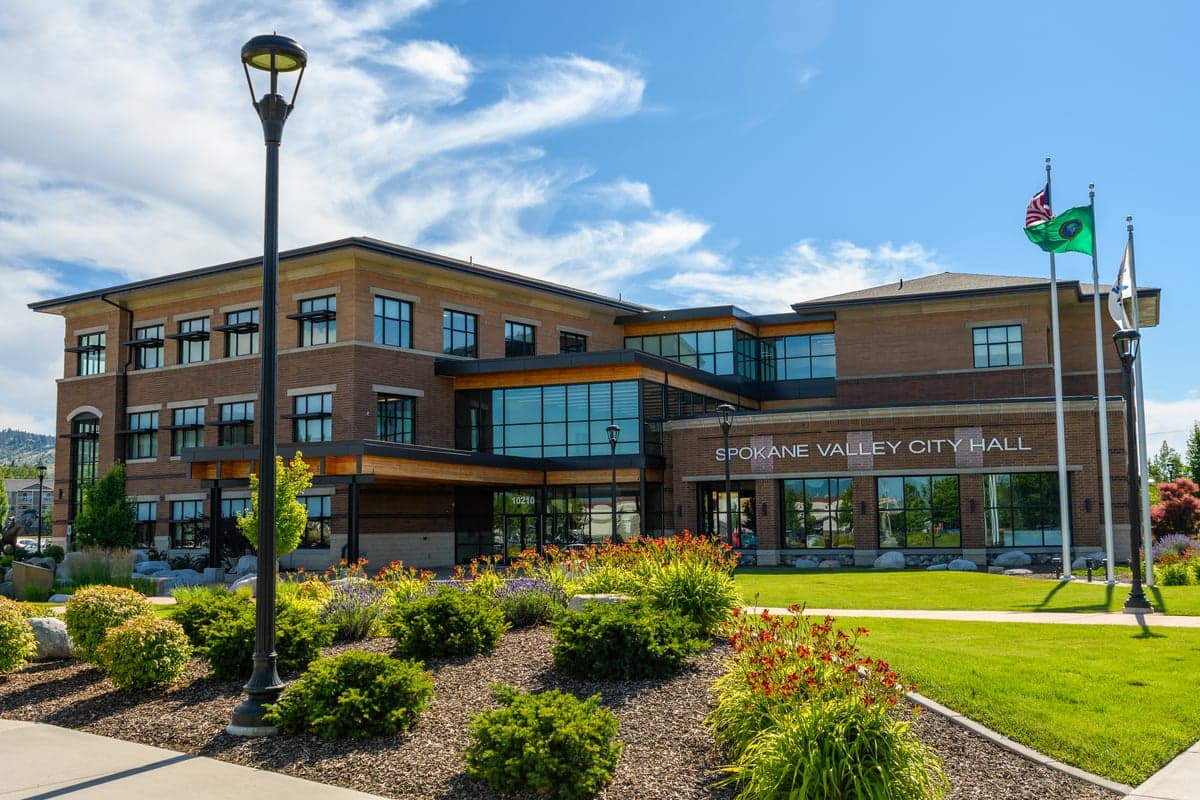
Photo: Wikipedia
Demographics of Spokane Valley, WA
Affluence Level in Spokane Valley, WA
A middle-class area roughly in line with national averages across income, home values, education, and employment.
People of Spokane Valley, WA
The people of Spokane Valley today form a predominantly white, family-oriented community of 105,460 residents, with a notably low foreign-born share of 2.2% and a college attainment rate of 24.8%. The city’s character is shaped by its roots in working-class industry and agriculture, producing a population that values self-reliance, outdoor recreation, and conservative governance. While 82.7% of residents identify as white, the Hispanic population has grown to 7.5%, and small East/Southeast Asian (1.5%) and Black (1.3%) communities add modest diversity, though the Indian-subcontinent population registers at 0.0%.
How the city was settled and grew
Spokane Valley’s population history begins not with a founding city but with the Spokane Tribe’s seasonal use of the prairie and riverbanks for fishing and gathering. Euro-American settlement accelerated after the 1880s arrival of the Northern Pacific Railway, which transformed the valley into a transportation corridor. The original wave of settlers were homesteaders and farmers—many of German, Scandinavian, and Irish stock—who took up dryland wheat and apple orchards. The Greenacres neighborhood, platted in 1908, became a hub for these agricultural families, with its grid of small farms and a commercial strip serving the rural population. A second wave arrived during the 1910s and 1920s, drawn by the Spokane Valley Land & Water Company’s irrigation projects, which opened the Trentwood area to intensive farming. The post-World War II boom brought a third wave: returning veterans and their families, who settled in new subdivisions like Opportunity, a planned community built on former farmland that offered affordable single-family homes. By 1960, the valley’s population had swelled to roughly 30,000, still overwhelmingly white and native-born, with a strong ethos of hard work and neighborly self-sufficiency.
Modern era (post-1965)
The 1965 Hart-Cellar Act had little direct effect on Spokane Valley’s demographics, as the city never became a destination for post-1965 immigration waves. Instead, the modern era has been defined by domestic in-migration from other parts of Washington and the Pacific Northwest. The 1970s and 1980s saw suburbanization accelerate as families left Spokane’s urban core for larger lots and lower taxes in the valley. The Ponderosa neighborhood, developed in the 1970s, attracted middle-class families with its ranch-style homes and proximity to the Spokane River. The 1990s brought a smaller but notable influx of retirees and second-home buyers from California and the West Coast, drawn by lower housing costs and a more conservative political climate. These newcomers concentrated in newer subdivisions like Barker, near the Idaho border, where large-lot homes and gated communities appealed to those seeking privacy. The Hispanic population, while still small at 7.5%, has grown steadily since 2000, primarily through domestic migration from other Washington counties and the Southwest. Hispanic families have settled most visibly in the Sprague-Appleway corridor, where older, more affordable housing stock and rental properties provide entry points. The East/Southeast Asian community (1.5%) is largely composed of Vietnamese and Filipino families who arrived in the 1980s and 1990s, often through secondary migration from larger West Coast cities; they are dispersed across the valley but have a small cluster of businesses near the Spokane Valley Mall area. The Black population (1.3%) remains tiny and is concentrated in the Broadway district, near the city’s southern edge. Overall, the city’s racial and ethnic composition has shifted only modestly since 2000, with the white share declining from 90% to 82.7%, while the Hispanic share doubled from 3.5% to 7.5%.
The future
Spokane Valley’s population is projected to grow modestly, reaching roughly 115,000 by 2035, driven by continued domestic in-migration from higher-cost West Coast metros and natural increase. The city is not tribalizing into distinct ethnic enclaves; instead, it is slowly homogenizing as Hispanic families integrate into predominantly white neighborhoods and the small Asian and Black communities remain dispersed. The foreign-born share is expected to remain below 5%, as the city lacks the job base or social networks to attract significant international immigration. The most notable demographic shift will be aging: the median age of 38 is rising as baby boomers retire in place, and younger families are increasingly priced out of Spokane’s core and seek affordable homes in the valley’s eastern fringes. The Barker and Ponderosa areas will likely see the most new construction, attracting a mix of young families and empty-nesters. The Hispanic population will continue to grow, possibly reaching 10-12% by 2035, but will remain a minority group without forming a majority-minority neighborhood. The city’s political character—solidly Republican, with a strong libertarian streak—will persist, as new arrivals tend to be conservative-leaning families and retirees seeking lower taxes and less regulation.
For someone moving in now, Spokane Valley offers a stable, predominantly white, family-oriented community with a conservative ethos and a slowly diversifying population. The city is not becoming a melting pot or a collection of ethnic enclaves; it is a place where domestic migrants—mostly from the West Coast—join a long-established native-born population. The low foreign-born share and modest racial change mean that newcomers will find a culturally homogeneous environment, with the Hispanic community as the only growing minority group. This is a city where the past—farming, railroads, and self-reliance—still shapes the present, and where the future looks much like the present, only slightly older and slightly more diverse.
* Values derived from national, state, county, city and local statistics and may differ in a specific area. Last updated: 2026-04-21T11:09:32.000Z
Narrative content on this page is AI-generated and may contain mistakes. Verify any details that matter before acting on them.
ReloMaps may earn a commission from affiliate links at no extra cost to you.