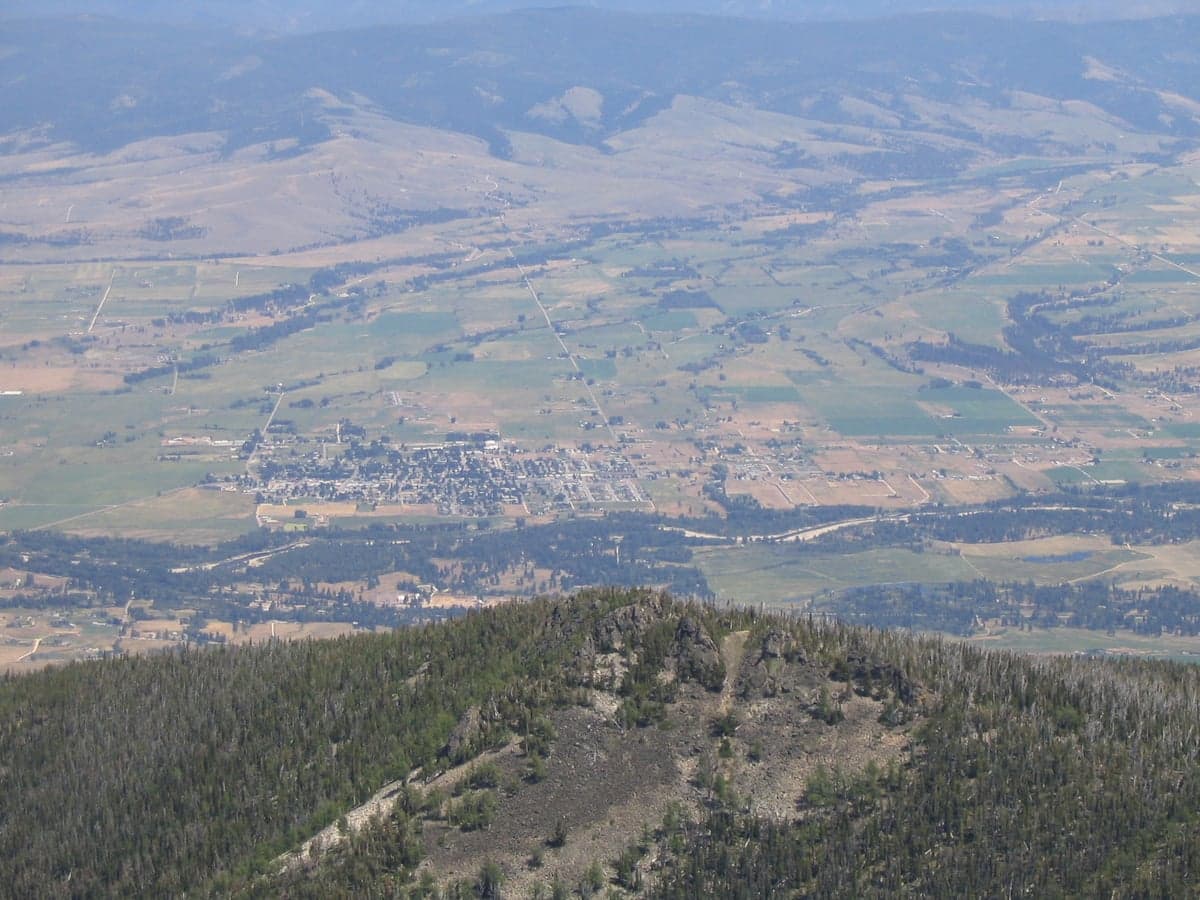
Photo: Wikipedia
Quality of Life in Stevensville, MT
A high quality of life with strong walkability, manageable living costs, healthy neighborhood signals, and solid amenity access.
What does Quality of Life tell us?
Quality of Life blends cost of living, nearby amenities, socioeconomic signals, and neighborhood character. City-level scores represent the whole municipality; individual neighborhoods can differ.
What does this tell us?
Quality of Life blends cost of living, nearby amenities, socioeconomic signals, and neighborhood character. City-level scores represent the whole municipality; individual neighborhoods can differ.
Cost of Living
The Real Cost of Living in Stevensville, MT for 2026
| Tier | Individual | Family (4) |
|---|---|---|
| Survival | $16k | $30k |
| Comfortable | $65k | $96k |
| Luxury | $95k+ | $148k+ |
| Elite (Top 5%) | $121k+ | $187k+ |
55%
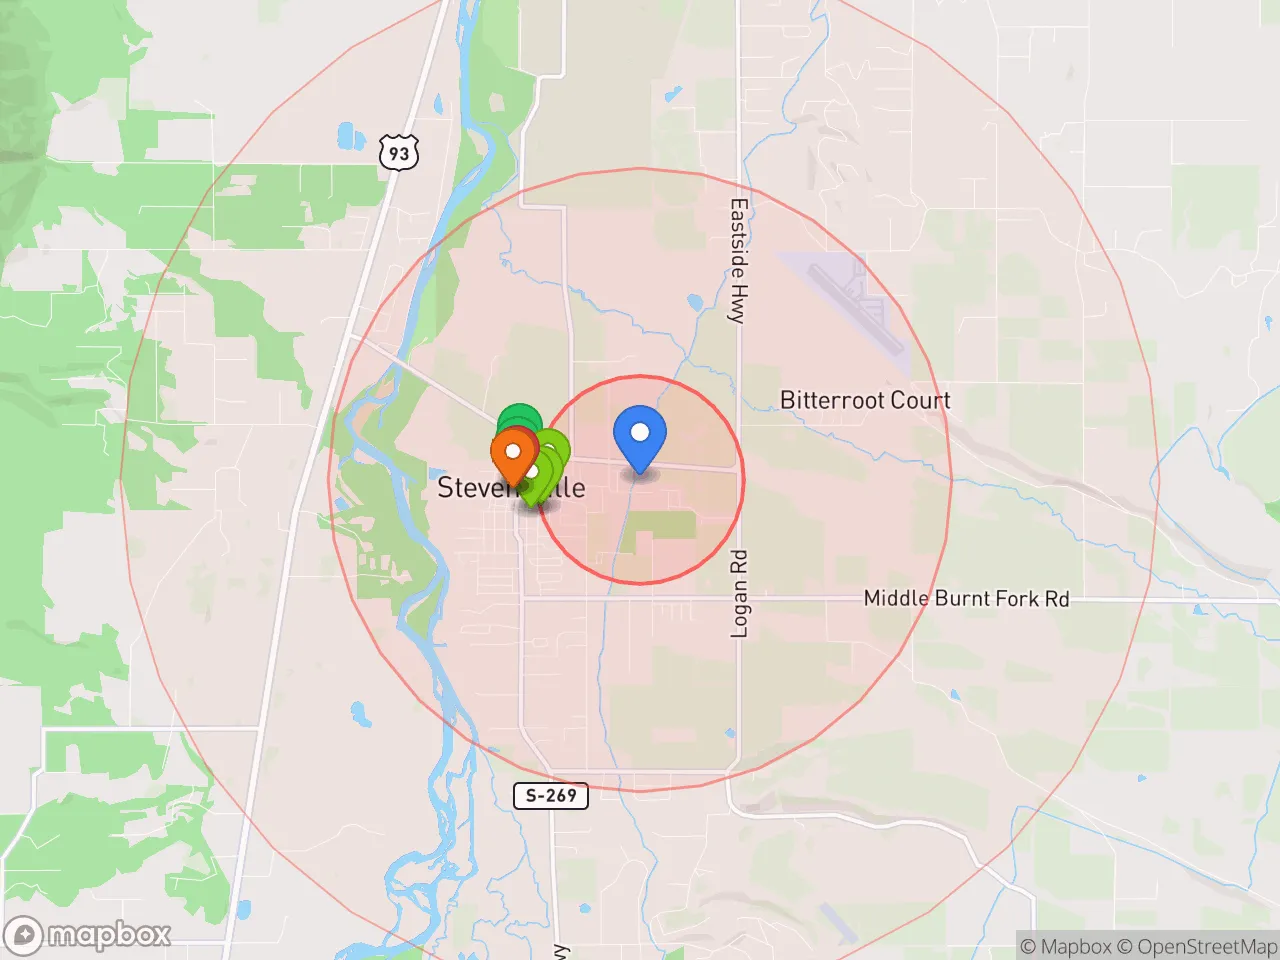
The Area Signal
A metric tracking the socioeconomic signals of the area.
Hobbies
Explore the areaGroceries
1 within 10 miles
Gas
4 within 10 miles
Hospital
2 within 20 miles
Airport
SEA — Seattle–Tacoma International
Post Office
USPS — Stevensville, MT
Critical Amenities
Quality-of-Life Analysis
Stevensville, Montana, presents a quality of life defined by small-town character and relative affordability compared to the booming Bitterroot Valley corridor, attracting a mix of remote workers, retirees, and families seeking a quieter pace. With a cost of living index at exactly 100—matching the national average—the town offers a financial foothold that is increasingly rare in western Montana, where many communities now exceed the U.S. baseline. The population skews toward those who value outdoor access and a tight-knit social fabric, with a median age around 44 and a growing cohort of professionals commuting to Missoula or working remotely from home offices.
Cost of living, housing affordability, and how Stevensville compares to nearby towns
Stevensville’s cost of living sits at the national average, but its housing market tells a more nuanced story when stacked against neighbors like Hamilton or Missoula. The median home value of $336,500 is significantly lower than Missoula’s median (which exceeded $500,000 in 2025), making Stevensville one of the more attainable entry points in the Bitterroot Valley. Median rent of $1,013 is roughly 20% below the Montana state average, a meaningful gap for renters who might otherwise be priced out of Hamilton or Florence. However, wages in the immediate area have not kept pace with rising property taxes and insurance costs, so affordability is strongest for those bringing out-of-area income or a paid-off home. The average commute of 24.5 minutes reflects the reality that many residents drive north to Missoula for work or shopping, a trade-off for lower housing costs that is common across the valley.
Local amenities, schools, and what daily life feels like in Stevensville
Daily life in Stevensville revolves around a walkable historic Main Street, the nearby Lee Metcalf National Wildlife Refuge, and a calendar of community events like the annual Creamery Picnic and farmers market. The Stevensville School District (K-12) serves roughly 1,200 students and posts graduation rates near 90%, though class sizes and per-pupil funding lag behind Missoula County’s larger districts. For groceries and daily errands, residents rely on local markets and the small but serviceable downtown; for big-box retail or specialized healthcare, the 25-minute drive to Missoula is a near-daily reality for many. The town’s rhythm is distinctly unhurried—coffee shops and the public library serve as social hubs—and outdoor recreation (hiking the St. Mary’s Peak trail, fishing the Bitterroot River) is the primary evening and weekend draw.
Stevensville is best suited for those who prioritize quiet, space, and nature over urban amenities and who can absorb the commute to Missoula for employment or specialized services. Retirees on fixed incomes will find the rent and home values manageable, while families with school-age children benefit from the safe, low-crime environment and community involvement. Remote workers and tradespeople who can secure local contracts will find the cost-of-life balance favorable, though those seeking nightlife, cultural density, or high-paying local jobs should look toward Missoula or Bozeman instead.
Crime in Stevensville, MT
Lower crime rates than 95% of comparable U.S. locations.
Violent CrimeViolent Crime Analysis
Property CrimeProperty Crime Analysis
Crime Analysis
Stevensville, Montana, presents a notably mixed safety profile: while the town reports a violent crime rate of 0 per 100,000 residents—a figure that places it among the safest communities in the state for personal safety—its property crime rate of 827.9 per 100,000 is significantly elevated, exceeding both the Montana average and national benchmarks. This combination of zero violent incidents alongside a higher-than-expected property crime volume makes Stevensville a place where residents generally feel secure in their persons but must remain vigilant about theft and vandalism.
Crime in context
Stevensville’s violent crime rate of zero per 100,000 is a standout statistic, far below the Montana state average and the national rate. This absence of reported homicides, robberies, and aggravated assaults reflects a tight-knit, rural community where serious interpersonal violence is exceptionally rare. However, the property crime rate of 827.9 per 100,000 tells a different story. This figure is roughly 40% higher than the national average and well above the Montana state average, which itself tends to be lower than many other regions. The primary drivers are likely thefts from vehicles, burglaries of unoccupied homes, and occasional vandalism—crimes of opportunity that can spike in small towns with limited law enforcement coverage. It is important to note that Stevensville is not a large metro area; it is a small town in Ravalli County. The progressive judicial philosophy sometimes associated with larger, liberal-leaning cities is not a dominant factor here. Ravalli County’s justice system generally reflects more conservative, traditional approaches to prosecution and sentencing, which may help explain the absence of violent crime but does not fully account for the elevated property crime rate.
What residents experience
For daily life in Stevensville, the practical takeaway is that personal safety is very high. Walking alone at night, visiting local businesses, or letting children play in the yard are activities that carry minimal risk of violent confrontation. The primary concern for residents is property security. Unlocked cars, unattended bicycles, and sheds or garages without secure locks are common targets. Local law enforcement, while responsive, covers a large rural area, so prevention falls heavily on individual homeowners and renters. The community’s small size means that most property crime is opportunistic rather than organized, and neighbors often watch out for one another. The absence of violent crime is a major quality-of-life advantage, but the property crime rate serves as a reminder that Stevensville is not immune to the theft and burglary issues that affect many rural Montana towns.
Neighborhood-level variation in Stevensville is modest but present. The historic downtown core and older residential streets closer to Main Street tend to see slightly higher foot traffic and natural surveillance, which can deter some property crime. Outlying subdivisions and rural roads, where homes are more isolated and vehicles are parked in driveways or on the street, may experience a higher incidence of theft from vehicles and burglaries. The areas immediately surrounding the Bitterroot River and near the Stevensville Airport are generally considered very safe in terms of violent crime, but residents there should still take standard precautions like locking doors and securing valuables. Overall, the town’s safety profile is defined by a stark contrast: an enviable record on violent crime paired with a property crime rate that demands attention and proactive measures.
* Values derived from national, state, county, city and local statistics and may differ in a specific area. Last updated: 2026-04-30T04:41:02.000Z
Narrative content on this page is AI-generated and may contain mistakes. Verify any details that matter before acting on them.
ReloMaps may earn a commission from affiliate links at no extra cost to you.