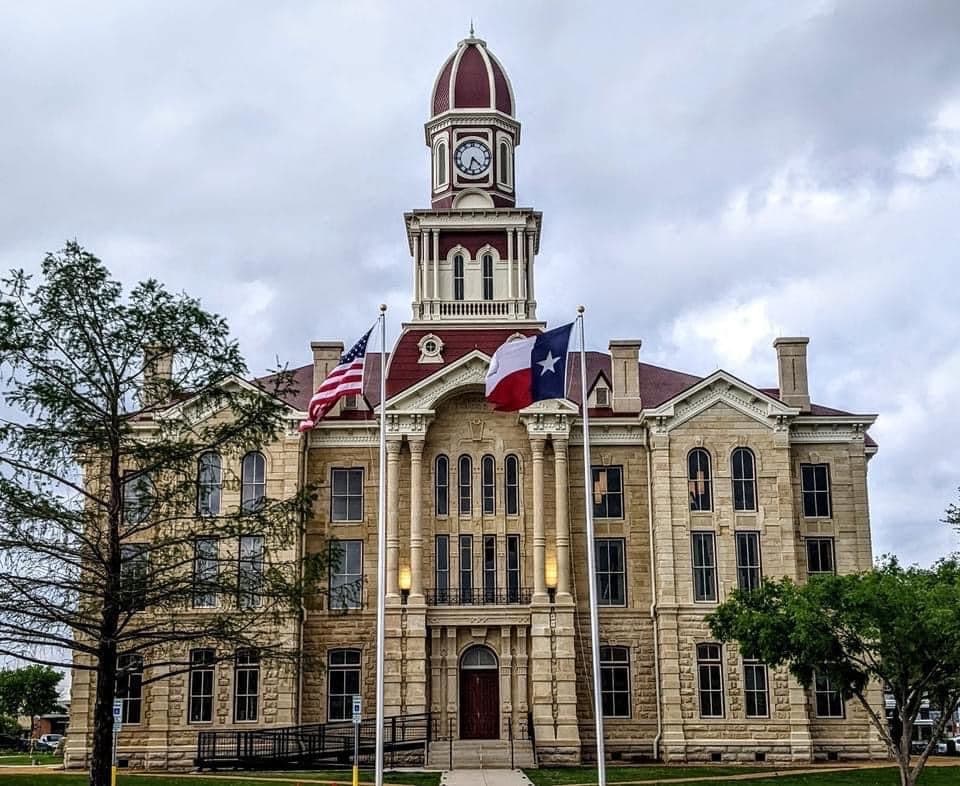
Photo: Wikipedia
Demographics of Fannin County
Affluence Level in Fannin County
A middle-class area roughly in line with national averages across income, home values, education, and employment.
People of Fannin County
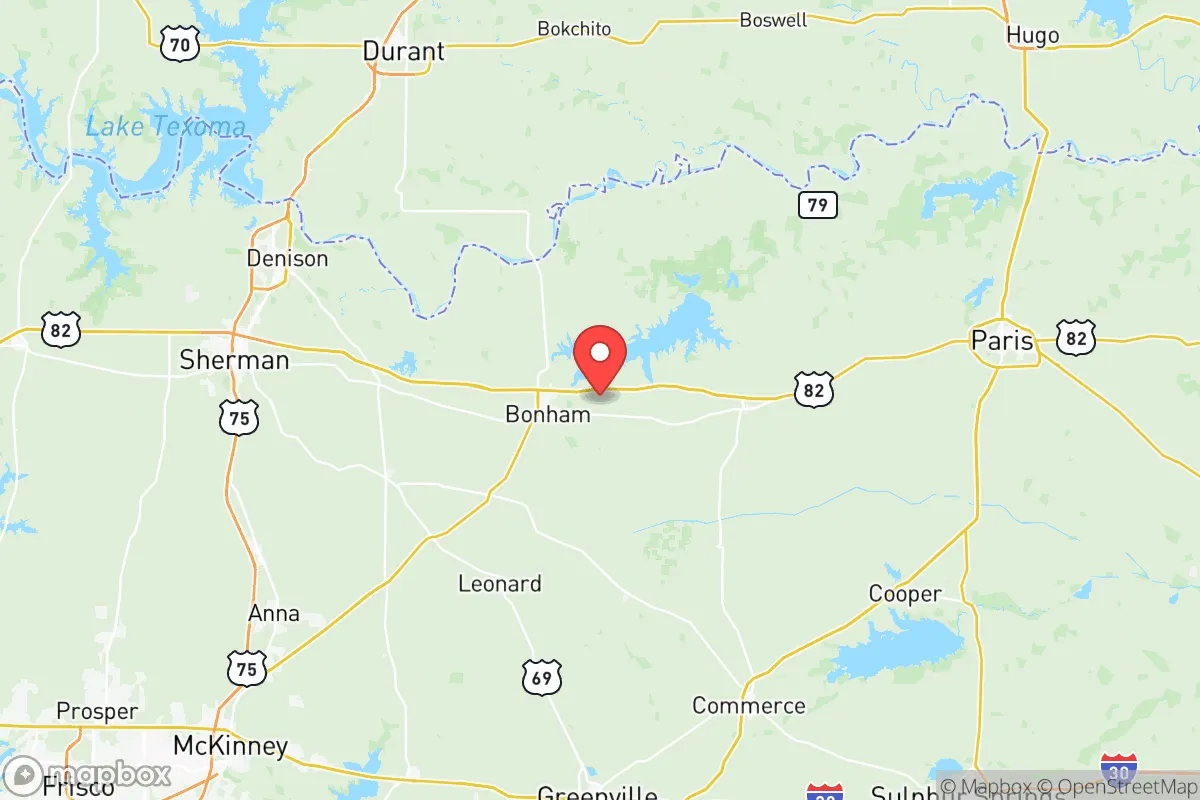
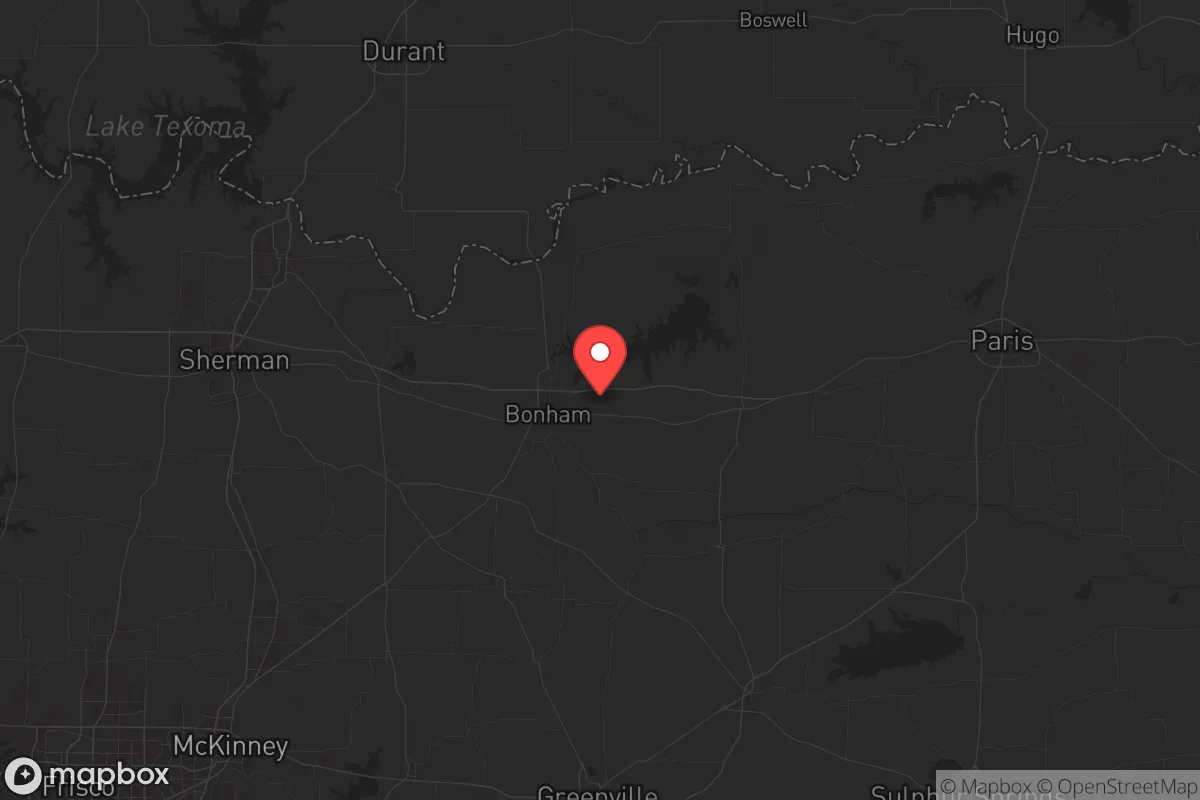
Today, Fannin County, Texas is a predominantly rural, politically conservative community of 36,525 residents, where White non-Hispanic residents make up 76.1% of the population and the foreign-born share sits at just 2.6% — well below the national average. The county’s identity is rooted in its agricultural heritage, with small towns like Bonham (the county seat), Honey Grove, and Leonard serving as cultural and commercial anchors. Unlike the booming suburban counties to the south, Fannin County retains a slower pace, a strong sense of local independence, and a population that is notably older and less diverse than the state as a whole.
Settlement & growth (pre-1960)
Before Anglo-American settlement, the area that is now Fannin County was part of the traditional territory of the Caddo Confederacy, particularly the Kadohadacho and Hasinai bands, who lived in settled agricultural villages along the Red River and its tributaries. The Caddo were largely displaced by the 1830s through a combination of disease, land cessions, and forced removal to Indian Territory (present-day Oklahoma). Spanish and French explorers passed through the region in the 17th and 18th centuries, but no permanent European colonies were established within the county’s boundaries.
The first major wave of Anglo-American settlers arrived in the 1830s and 1840s, primarily from the Upper South — Tennessee, Kentucky, Arkansas, and Missouri. These were largely Scots-Irish and English families drawn by the promise of cheap, fertile land under the Republic of Texas’s headright system. They established the county’s earliest settlements: Bonham (founded 1837), Honey Grove (1837), and Leonard (1840s). These settlers were subsistence farmers and ranchers, and their cultural imprint — evangelical Protestantism, suspicion of centralized authority, and a strong work ethic — remains visible in the county’s politics and social norms today.
By the 1850s, a smaller but notable wave of German and Czech immigrants arrived, though they never formed the dense ethnic enclaves seen in Central Texas counties like Gillespie or Lavaca. Instead, they scattered into farming communities such as Dodd City and Ravenna, where their surnames and Lutheran church affiliations persist. The 1860 census recorded about 8,000 residents, overwhelmingly native-born White, with fewer than 1,000 enslaved Black people concentrated on cotton plantations near the Red River.
After the Civil War and Reconstruction, the county’s Black population grew modestly as freedmen established small farming communities, most notably Selfs (southeast of Bonham) and Ladonia. However, the imposition of Jim Crow laws and sharecropping kept this population economically marginalized. The early 20th century brought no major new immigrant waves; instead, the county experienced steady out-migration as young people left for Dallas and other industrial centers. The Dust Bowl of the 1930s hit the county’s cotton-dependent economy hard, accelerating this rural exodus. By 1960, the population had fallen to roughly 20,000 — a decline from a 1900 peak of 31,000 — and the county had become overwhelmingly White, native-born, and Protestant.
Modern era (post-1965)
The 1965 Hart-Cellar Act had virtually no direct effect on Fannin County. Unlike Dallas, Houston, or the Rio Grande Valley, the county attracted almost no post-1965 immigrants. The foreign-born share today — 2.6% — is among the lowest in Texas, and the county’s Asian (0.5%) and Indian (0.0%) populations are negligible. The primary demographic shift since the 1960s has been domestic: the slow but steady in-migration of White retirees and working-class families from the Dallas-Fort Worth metroplex, seeking lower housing costs and a rural lifestyle.
This domestic migration has concentrated in the county’s southern tier, particularly along the U.S. Highway 69 corridor in Trenton and Whitewright, where new subdivisions have sprouted on former farmland. These newcomers are culturally similar to the existing population — predominantly White, conservative, and Christian — but tend to be slightly more affluent and more likely to commute to jobs in Sherman, Denison, or even Plano. The county’s Hispanic population has grown from roughly 3% in 1990 to 12.6% today, driven largely by agricultural labor and service-sector work in Bonham and Savoy. However, this growth has not produced the large, visible ethnic enclaves seen in other parts of Texas; instead, Hispanic residents are dispersed across the county, and the overall social fabric remains overwhelmingly Anglo.
The Black population has held steady at around 6.3%, concentrated in the historic communities of Selfs and Ladonia, with smaller numbers in Bonham. There has been no significant return migration from Northern cities, nor any notable influx from Africa or the Caribbean. The county’s college-educated share — 20.2% — is well below the state average of roughly 32%, reflecting the limited white-collar job base and the out-migration of young adults for higher education.
The future
Fannin County is likely to continue its slow, modest growth — perhaps reaching 40,000 by 2040 — driven almost entirely by domestic in-migration from the Dallas-Fort Worth metroplex. This will gradually increase the share of college-educated and higher-income residents, particularly in the southern towns closest to the suburban frontier. However, the county’s cultural identity is unlikely to change dramatically: the newcomers are culturally similar to the existing population, and the county lacks the economic magnets — major employers, universities, or transportation hubs — that would attract significant international immigration.
The Hispanic share may continue to rise slowly, reaching perhaps 15-18% by 2040, but assimilation into the broader Anglo culture is the dominant pattern. The Black and Asian shares are projected to remain flat. The county will not become a multicultural melting pot; instead, it will remain a predominantly White, conservative, rural community, with a slightly more diverse southern fringe. The biggest demographic challenge is aging: the median age of 44 is already well above the national median of 38, and the out-migration of young adults shows no sign of reversing.
For someone moving in now, Fannin County offers a stable, predictable social environment where the population is homogeneous by national standards, the pace is slow, and the political and cultural values are deeply conservative. It is not a place of rapid change or ethnic transformation, but rather a place where the 19th-century Anglo-Texan heritage remains the dominant force in daily life.
* Values derived from national, state, county, city and local statistics and may differ in a specific area. Last updated: 2026-06-03T03:40:20.000Z
Narrative content on this page is AI-generated and may contain mistakes. Verify any details that matter before acting on them.
ReloMaps may earn a commission from affiliate links at no extra cost to you.