Photo: Wikipedia
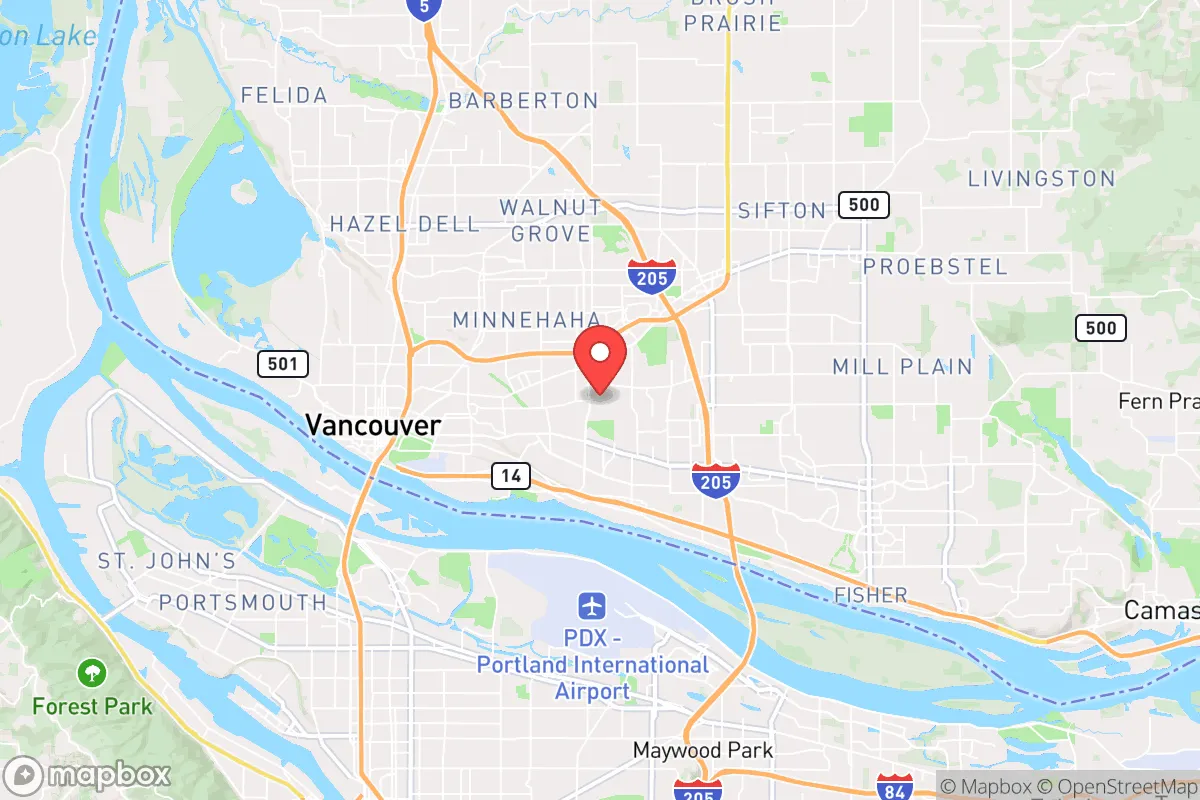
Quality of Life in Vancouver, WA
A high quality of life with strong walkability, manageable living costs, healthy neighborhood signals, and solid amenity access.
What does Quality of Life tell us?
Quality of Life blends cost of living, nearby amenities, socioeconomic signals, and neighborhood character. City-level scores represent the whole municipality; individual neighborhoods can differ.
What does this tell us?
Quality of Life blends cost of living, nearby amenities, socioeconomic signals, and neighborhood character. City-level scores represent the whole municipality; individual neighborhoods can differ.
Cost of Living
47% above national average
The Real Cost of Living in Vancouver, WA for 2026
| Tier | Individual | Family (4) |
|---|---|---|
| Survival | $26k | $49k |
| Comfortable | $86k | $126k |
| Luxury | $132k+ | $205k+ |
| Elite (Top 5%) | $156k+ | $242k+ |
62%
The Area Signal
A metric tracking the socioeconomic signals of the area.
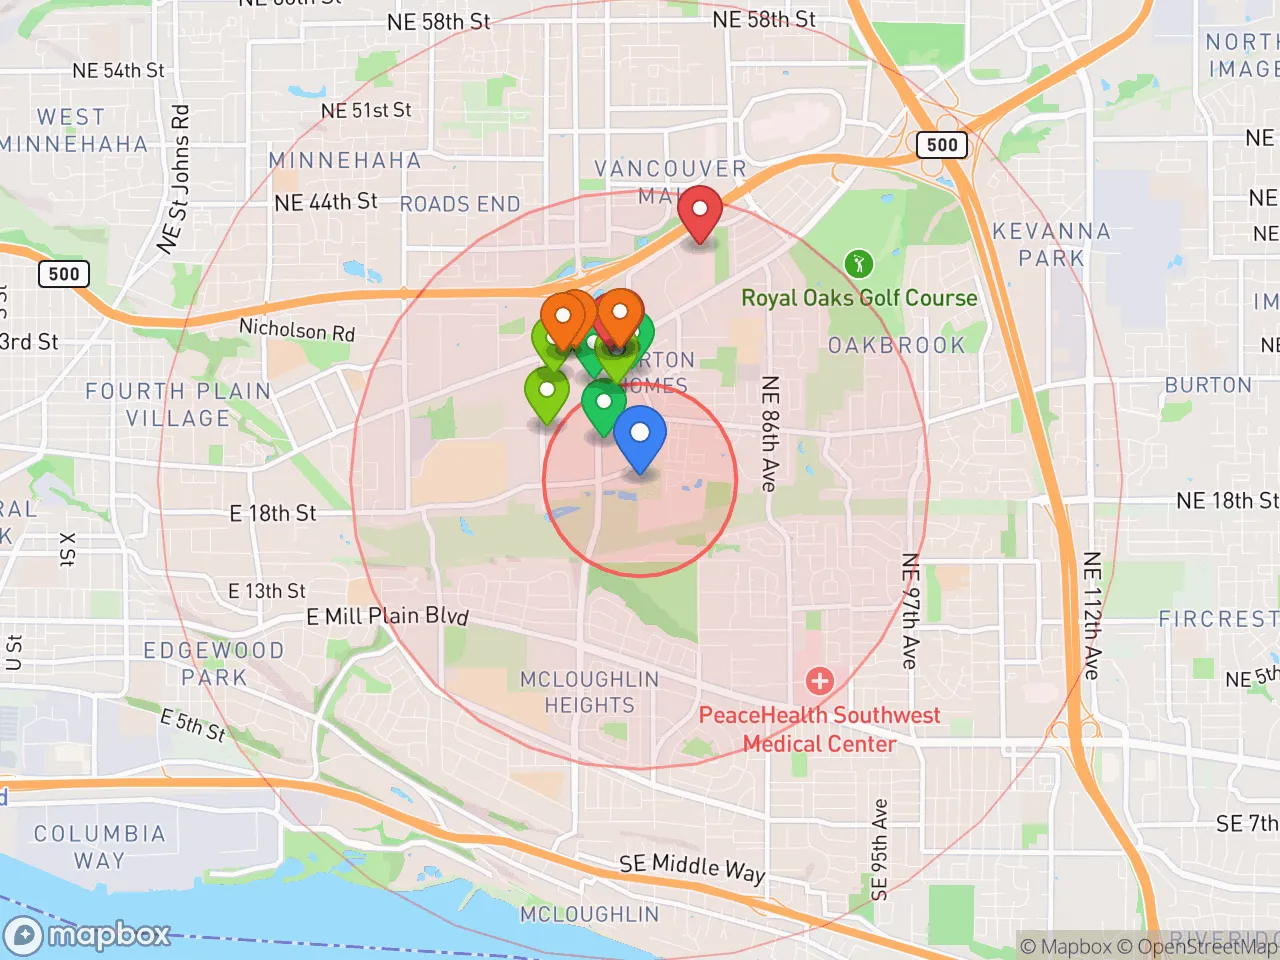
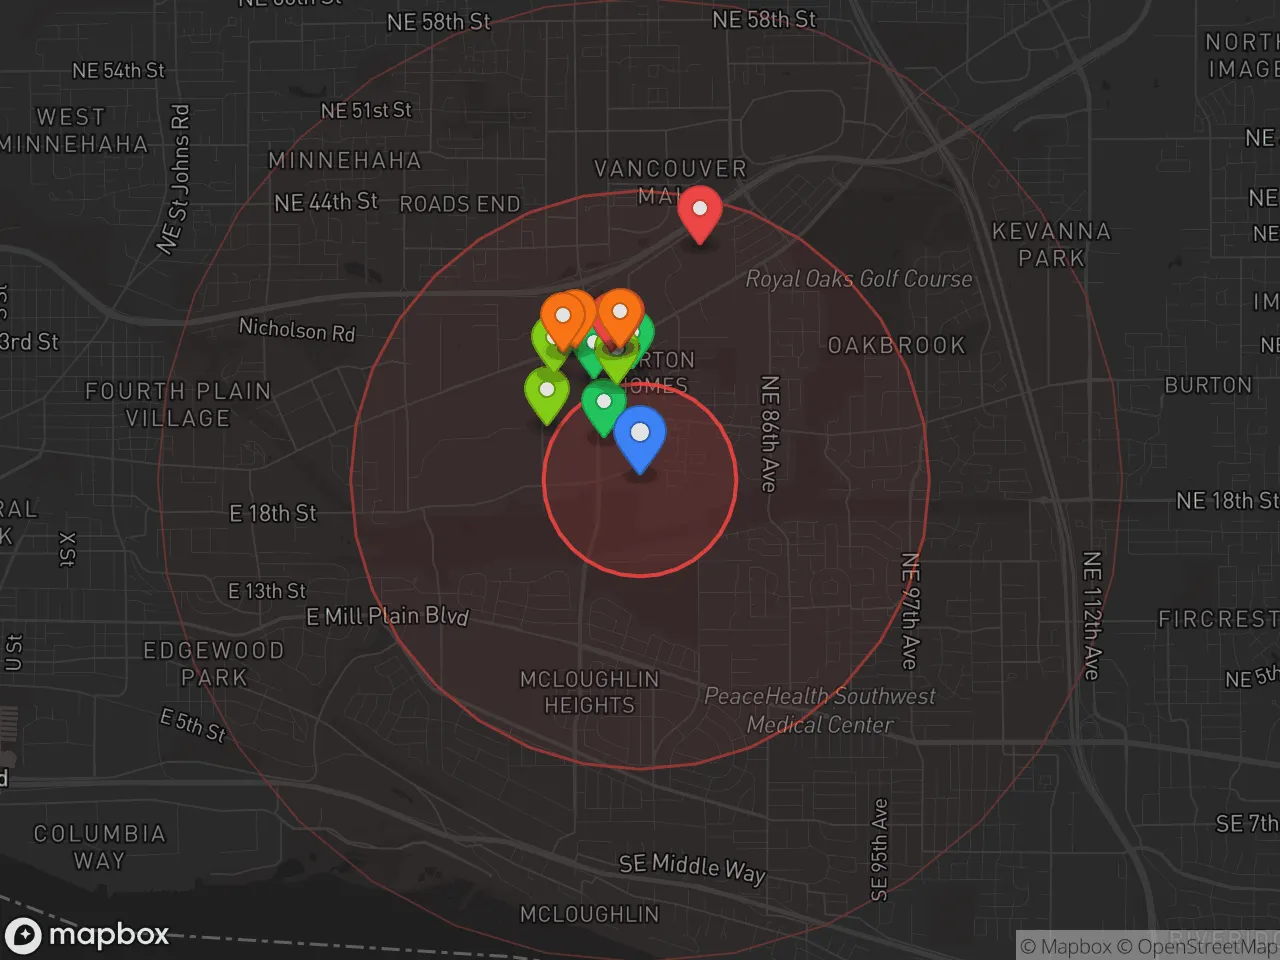
Hobbies
Explore the areaGroceries
7 within 10 miles
Gas
20 within 10 miles
Hospital
20 within 20 miles
Airport
PDX — Portland International
Post Office
USPS — Vancouver, WA
Critical Amenities
Quality-of-Life Analysis
Vancouver, Washington, presents a quality of life shaped by its position as a more affordable alternative to Portland, Oregon, while still offering a relatively high cost of living compared to the national average. With a cost of living index of 147 (where 100 equals the U.S. average), the city attracts a mix of young professionals, families, and retirees who are willing to pay a premium for proximity to Portland’s urban amenities without the Oregon income tax. The population skews slightly older and more family-oriented than Portland’s, with a median age of 37 and a growing number of households earning between $60,000 and $100,000 annually.
Housing costs and affordability compared to Portland and Seattle
Housing is the primary driver of Vancouver’s elevated cost of living, though it remains a relative bargain compared to the Portland metro area. The median home value in Vancouver is $440,300, which is roughly 15% lower than Portland’s median of about $520,000 and dramatically less than Seattle’s $850,000. Median rent sits at $1,632, undercutting Portland’s average of $1,750 and Seattle’s $2,100. However, inventory has tightened since 2020, with the number of homes for sale down 30% year-over-year as of early 2026, pushing prices up 8% annually. For renters, the vacancy rate hovers around 4%, meaning competition for units under $1,500 is fierce. The trade-off is that Vancouver offers more square footage per dollar: a typical 1,500-square-foot home here costs about $440,000, whereas a comparable property in Portland’s inner neighborhoods would exceed $600,000. Property taxes are lower than in Oregon (Washington has no state income tax), but sales tax in Clark County is 8.4%, which adds to everyday expenses.
Schools, parks, and the daily commute rhythm
Daily life in Vancouver centers on a suburban pace with strong access to outdoor recreation and a commute that is manageable by regional standards. The average commute time is 23.4 minutes, well below Portland’s 28-minute average and Seattle’s 32-minute grind, thanks to the city’s relatively compact layout and the I-5 and I-205 corridors. The Vancouver Public Schools district serves about 23,000 students, with top-rated schools like Columbia River High School (rated 8/10 on GreatSchools) and Hearthwood Elementary (9/10) drawing families. For amenities, the city boasts over 90 parks, including the 190-acre Vancouver Lake Regional Park and the waterfront Renaissance Trail along the Columbia River. The downtown core has seen a revival since 2020, with new breweries, the Vancouver Farmers Market (open March–October), and the Kiggins Theatre showing indie films. Healthcare is anchored by PeaceHealth Southwest Medical Center, the region’s largest hospital, and the Vancouver Clinic network. For Portland access, the C-TRAN express bus reaches downtown Portland in 30 minutes, and the MAX Light Rail stops at the Expo Center just across the river.
Vancouver is best suited for those who want a quieter, more affordable base within commuting distance of Portland’s job market and cultural scene. Families with school-age children will find strong public schools and ample parks, while remote workers can leverage the lower housing costs and no state income tax. The city is less ideal for singles seeking a vibrant nightlife or walkable urban core—downtown Vancouver is compact and growing but still feels sleepy compared to Portland’s Pearl District. Retirees on fixed incomes should note that while housing is cheaper than Seattle, the overall COL index of 147 means everyday goods and services are 47% above the national average, so a budget of at least $55,000 per year is advisable for a comfortable lifestyle.
Crime in Vancouver, WA
Higher crime rates than 61% of comparable U.S. locations.
Violent CrimeViolent Crime Analysis
Property CrimeProperty Crime Analysis
Crime Analysis
Vancouver, Washington, reports a violent crime rate of 551.3 incidents per 100,000 residents and a property crime rate of 2,867.6 per 100,000, placing it above both the national and Washington state averages for overall crime. While the city benefits from its proximity to Portland, Oregon, and a growing economy, these crime figures reflect significant public safety challenges that potential residents should weigh carefully. The data indicates that Vancouver is not a low-crime community, and its safety profile is shaped by broader regional and judicial trends.
Crime in context
Vancouver’s violent crime rate of 551.3 per 100,000 is roughly 50% higher than the national average of approximately 370 per 100,000 and notably exceeds Washington state’s average of about 340 per 100,000. Property crime in Vancouver, at 2,867.6 per 100,000, is also elevated—roughly 40% above the national average of 2,042 per 100,000. These figures place Vancouver among the more dangerous mid-sized cities in the Pacific Northwest. A key factor is the influence of progressive criminal justice policies common in the region, including those in neighboring Multnomah County (Portland), which often result in reduced incarceration rates and lenient sentencing for repeat offenders. This ideological approach, while sympathetic to offenders, directly contributes to higher recidivism and more criminals remaining on the street, negatively impacting public safety and justice for victims.
What residents experience
Residents commonly report property crimes such as vehicle break-ins, theft from porches, and residential burglaries as persistent nuisances. Violent incidents, including aggravated assault and robbery, are concentrated in specific areas but can occur citywide. The presence of a large, transient population and drug-related activity, particularly linked to the fentanyl crisis, exacerbates both violent and property crime rates. Vancouver’s status as a large metro area adjacent to Portland means it absorbs spillover crime from a jurisdiction with some of the most progressive district attorneys and judges in the nation. This judicial environment, focused on rehabilitation over accountability, leads to more criminals cycling through the system without meaningful consequences, directly harming victims and eroding community trust in law enforcement.
Neighborhood-level safety varies considerably. Areas east of Interstate 205, such as the Cascade Park and Fisher’s Landing neighborhoods, generally report lower crime rates and are considered safer. In contrast, central Vancouver, including the Uptown Village and downtown core, experiences higher concentrations of property crime and occasional violent incidents. The Fruit Valley and Fourth Plain corridor corridors also see elevated crime statistics. Prospective residents should research specific block-level data and consider that even in safer neighborhoods, the city’s overall crime climate—shaped by regional progressive policies—remains a significant concern for families and businesses prioritizing security.
* Values derived from national, state, county, city and local statistics and may differ in a specific area. Last updated: 2026-04-21T11:07:28.000Z
Narrative content on this page is AI-generated and may contain mistakes. Verify any details that matter before acting on them.
ReloMaps may earn a commission from affiliate links at no extra cost to you.