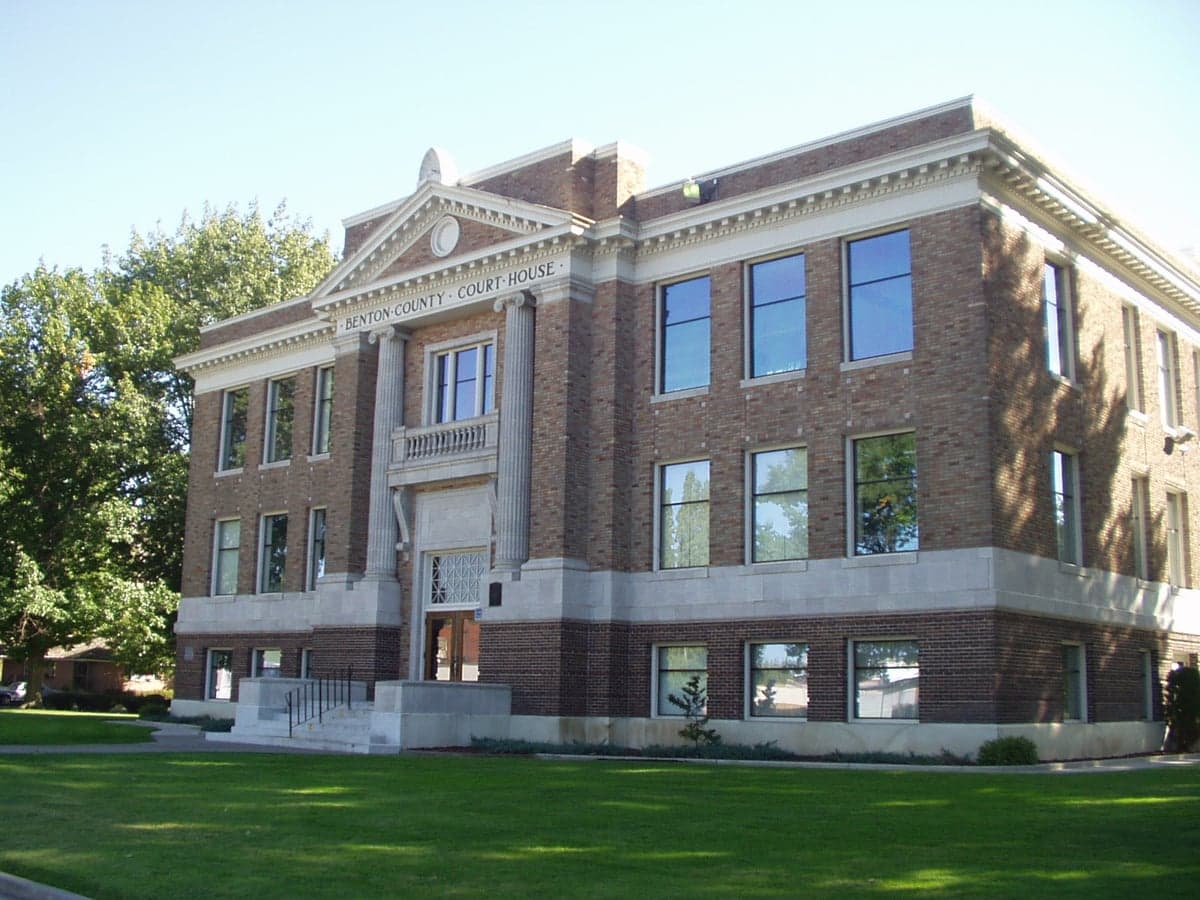
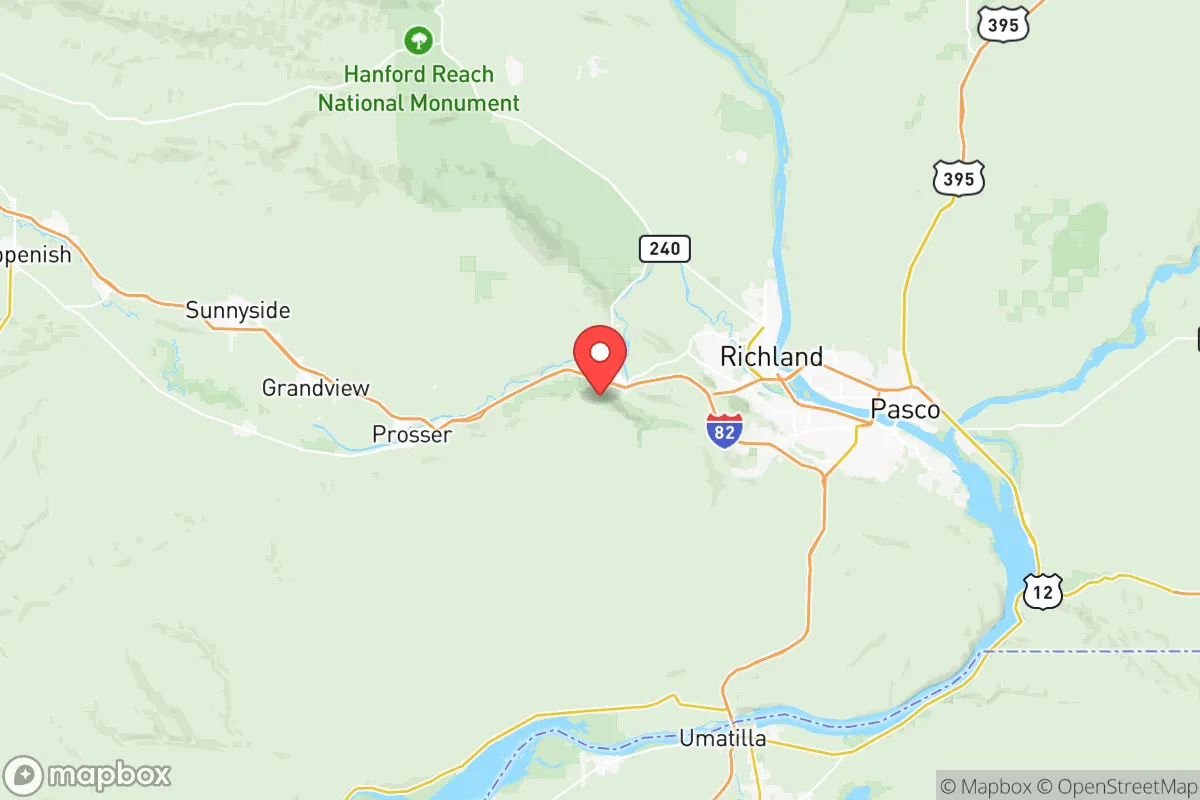
Photo: Wikipedia
Demographics of Benton County
Affluence Level in Benton County
A middle-class area roughly in line with national averages across income, home values, education, and employment.
People of Benton County
The people of Benton County, Washington, today number roughly 210,000, forming a community defined by its Hanford nuclear reservation roots, a strong agricultural base, and a notably high proportion of Hispanic residents. The county is less diverse than the national average in some measures—with a 65.7% white population and only 6.6% foreign-born—but its 24.8% Hispanic share is nearly double the state average, concentrated in the agricultural towns of the lower Yakima Valley. The population is relatively well-educated, with 33.0% holding a bachelor's degree or higher, a figure driven by the technical workforce at Hanford and the Pacific Northwest National Laboratory in Richland. This is a place where a Cold War-era federal project, a century of irrigated farming, and a growing Hispanic community have created a distinct, pragmatic, and politically conservative culture.
Settlement & growth (pre-1960)
Before American settlement, the Benton County area was the homeland of the Wanapum, Yakama, and Umatilla peoples, who lived along the Columbia River for thousands of years, fishing for salmon at Celilo Falls and trading goods across the Plateau. The first non-Native presence came with the Lewis and Clark Expedition in 1805, followed by fur traders and missionaries in the 1830s and 1840s, but permanent American settlement did not begin until after the Yakama War of 1855-1858 and the subsequent forced removal of Native tribes to reservations. The county was formally created in 1905 from Yakima County, named after Missouri Senator Thomas Hart Benton, but its population remained tiny—fewer than 8,000 people as late as 1920—because the arid landscape required massive irrigation projects to become productive farmland.
The first major wave of settlers were homesteaders drawn by the federal Desert Land Act of 1877 and the Carey Act of 1894, which offered cheap land in exchange for irrigation development. These early arrivals were predominantly white Anglo-American farmers from the Midwest and Great Plains, along with a smaller number of German and Scandinavian immigrants who established farms around Prosser and Benton City. The real population boom began with the completion of the Yakima Project irrigation system in the 1910s and 1920s, which transformed the sagebrush desert into one of the nation's most productive agricultural regions. By 1930, the county's population had grown to 10,000, with Kennewick emerging as the primary commercial center for the apple, cherry, and grape growers of the lower Yakima Valley.
The single most transformative event in Benton County's history was the 1943 selection of the Hanford Site for plutonium production as part of the Manhattan Project. The federal government built a secret city of 50,000 workers almost overnight, drawing engineers, construction laborers, and military personnel from across the country. After World War II, Hanford's mission continued through the Cold War, and the population of the Tri-Cities area—Richland, Kennewick, and Pasco (the latter in Franklin County)—exploded. Richland, in particular, was built as a planned government town for Hanford workers, with a highly educated, middle-class, and politically conservative population that remains a defining demographic force today. By 1960, Benton County's population had reached 62,000, a sixfold increase in three decades, driven almost entirely by the nuclear industry and its supporting infrastructure.
Modern era (post-1965)
The 1965 Hart-Cellar Act had a relatively modest direct impact on Benton County compared to coastal urban areas, because the county's economy did not initially attract large numbers of post-1965 immigrants from Asia or Latin America. Instead, the most significant demographic shift of the modern era has been the growth of the Hispanic population, which began with agricultural labor migration in the 1970s and accelerated through the 1990s and 2000s. Mexican-American farmworkers, many originally part of the Bracero Program (1942-1964), settled permanently in agricultural towns like Prosser and Benton City, where they now form a majority of the population in some census tracts. The Hispanic share of the county rose from roughly 5% in 1980 to 24.8% in 2024, making it the fastest-growing demographic group by far.
Domestic migration has also reshaped the county since the 1970s. The end of the Cold War brought a partial downsizing of Hanford's nuclear weapons mission, but the site was repurposed for environmental cleanup—the largest such project in the Western Hemisphere—which sustained a steady inflow of engineers, scientists, and project managers from other parts of the country. The Tri-Cities region, including Richland and Kennewick, has also attracted retirees and remote workers from the Seattle area and California, drawn by lower housing costs, a drier climate, and a more conservative political environment. This domestic in-migration has been overwhelmingly white and middle-class, reinforcing the county's existing demographic character even as the Hispanic population grows.
The East/Southeast Asian population, at 2.0%, and the Indian-subcontinent population, at 0.9%, are small but concentrated among the professional workforce at Hanford and the Pacific Northwest National Laboratory. These communities are dispersed rather than forming ethnic enclaves, with families living in the newer subdivisions of West Richland and south Kennewick. The Black population, at 1.5%, is similarly small and largely tied to military and Hanford-related employment. The foreign-born share of 6.6% is well below the national average of 13.7%, reflecting the county's limited appeal to recent immigrants outside of agricultural labor.
The future
Benton County is projected to become more Hispanic and slightly more diverse over the next 10-20 years, but the pace of change will be slower than in Washington's coastal counties. The Hispanic population, driven by higher birth rates and continued agricultural labor demand, is expected to approach 30-35% of the total by 2040, with the most concentrated growth in Prosser and Benton City. The white non-Hispanic population will continue to decline as a share, though it will remain the majority for the foreseeable future. The East/Southeast Asian and Indian-subcontinent populations are likely to grow modestly as Hanford's cleanup mission continues and the Pacific Northwest National Laboratory expands, but they will remain small single-digit percentages.
The county's cultural identity is evolving from a predominantly white, nuclear-industry, agricultural community into a more bilingual, bicultural region, particularly in the lower Yakima Valley. Political dynamics may shift as the Hispanic population grows, but the county's overall conservative lean—it voted for Donald Trump by 18 points in 2020—is unlikely to change dramatically, as Hispanic voters in the region tend to be more moderate than their counterparts in urban areas. The biggest demographic wildcard is the potential for a new nuclear mission at Hanford—such as advanced reactor development or tritium production—which could bring a new wave of highly educated, predominantly white professionals to Richland and West Richland.
For someone moving to Benton County now, the bottom line is this: you are joining a community that is growing steadily but not explosively, where the dominant cultural forces remain Hanford's technical workforce and the valley's agricultural heritage. The Hispanic presence is large and growing, especially in the smaller towns, but the county as a whole remains majority-white, politically conservative, and family-oriented. The schools in Richland and Kennewick are increasingly diverse, and the economy is stable, anchored by government contracts and agriculture. This is not a place of rapid demographic transformation, but of gradual, manageable change—a solid, middle-American community with a unique nuclear-history twist.

* Values derived from national, state, county, city and local statistics and may differ in a specific area. Last updated: 2026-08-08T13:41:12.000Z
Narrative content on this page is AI-generated and may contain mistakes. Verify any details that matter before acting on them.
ReloMaps may earn a commission from affiliate links at no extra cost to you.

