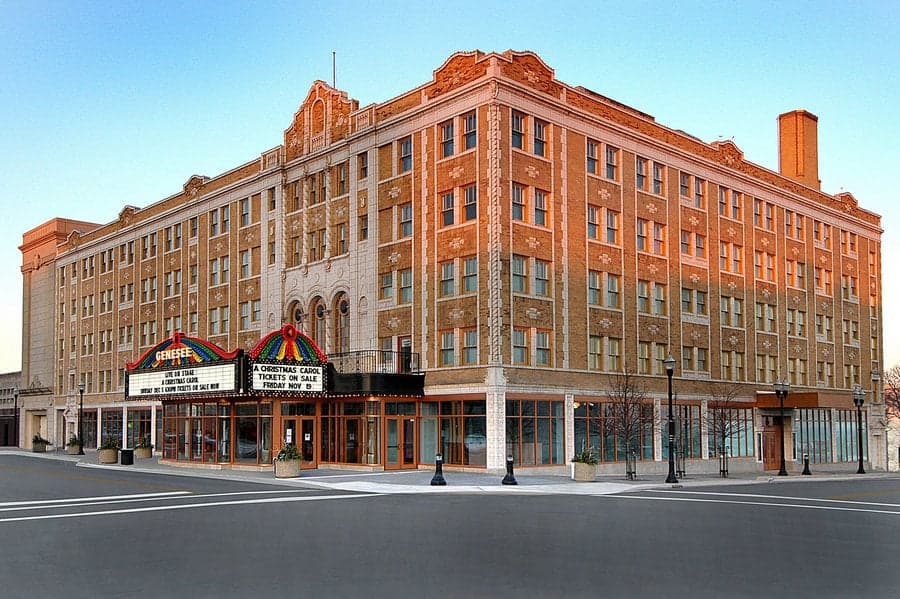
Photo: Wikipedia
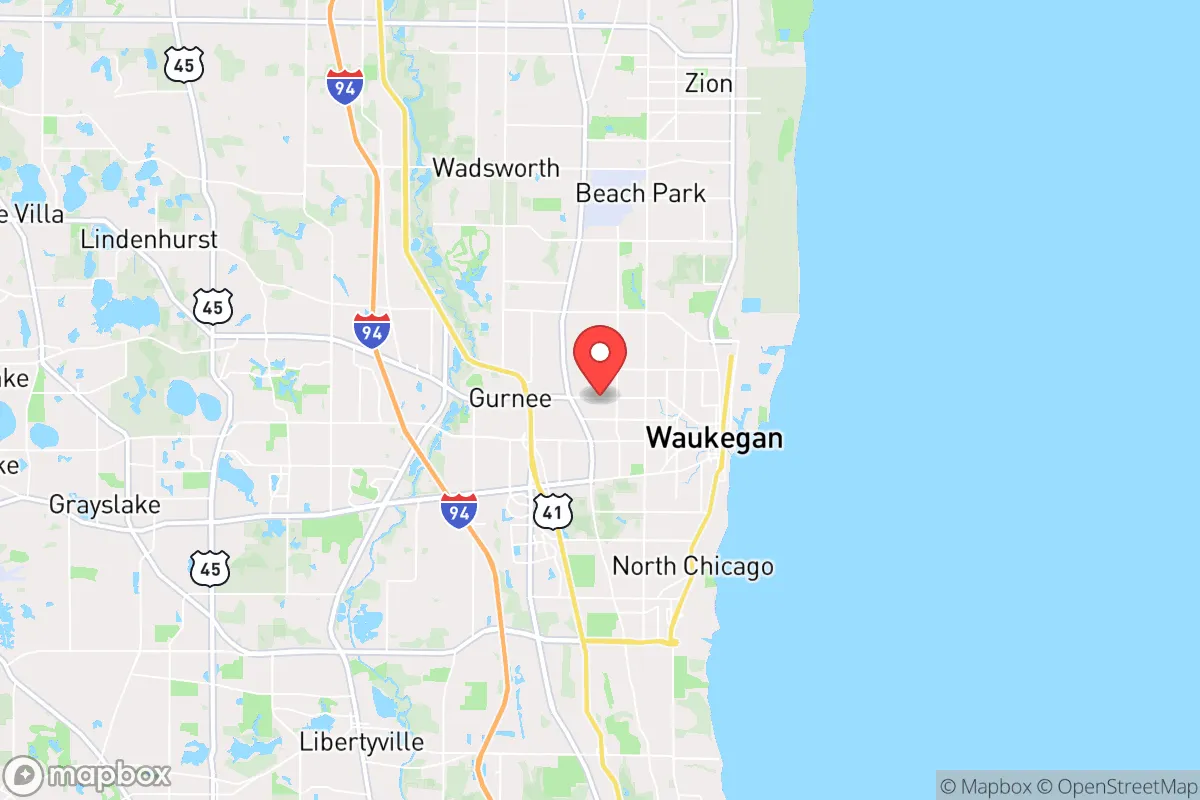
Demographics of Waukegan, IL
Affluence Level in Waukegan, IL
A middle-class area roughly in line with national averages across income, home values, education, and employment.
People of Waukegan, IL
Today, Waukegan, Illinois is a dense, majority-Hispanic city of 88,919 residents, defined by its working-class character and deep immigrant roots. With a foreign-born population of 19.3%, the city is a mosaic of Mexican, Puerto Rican, and Central American communities, alongside smaller but established Black, East/Southeast Asian, and Indian-subcontinent populations. Its identity is shaped by a historic lakefront industrial base that has given way to a service and logistics economy, creating a city that feels both gritty and resilient. The population is younger than the national median, with a median age of 33.5, and the city remains a primary entry point for new immigrants in Lake County.
How the city was settled and grew
Waukegan’s population history begins with its founding as a trading post in 1829, named after the Potawatomi word for "fort" or "trading post." The first major wave of settlers were Yankee and German farmers drawn by the fertile prairie and Lake Michigan access. The real population boom came with industrialization in the late 19th and early 20th centuries. The establishment of the U.S. Steel Corporation’s Waukegan plant in 1901, along with the Outboard Marine Corporation and other heavy manufacturers, pulled in a massive wave of European immigrants. Poles, Slovaks, and Italians arrived by the thousands, settling in the Downtown and South Side neighborhoods near the factories. The Little Fort area (the original settlement) became a dense, working-class enclave of Eastern Europeans. By 1920, Waukegan’s population had surged past 19,000, and it became a classic Great Lakes industrial city. The Great Migration brought a second major wave: African Americans from the Deep South, who arrived between 1940 and 1960 to work in the steel mills and foundries. They concentrated in the West Side and the area around Greenwood Avenue, forming the city’s historic Black community. This period cemented Waukegan’s identity as a multi-ethnic, blue-collar city, with distinct neighborhoods tied to specific industries and immigrant groups.
Modern era (post-1965)
The post-1965 era transformed Waukegan’s population more dramatically than any previous period. The Hart-Cellar Immigration Act opened the door to large-scale immigration from Latin America and Asia. Mexican and Puerto Rican families began arriving in the 1970s and 1980s, drawn by manufacturing jobs that were still available and by the lower cost of housing compared to Chicago. They settled heavily in the South Side and the Belvidere Road corridor, areas that had been vacated by departing European families. By 1990, the Hispanic share of the population had risen to 25%, and it accelerated as deindustrialization pushed white families to the suburbs. The 2000s saw a second wave of Central American immigrants, particularly from Guatemala and El Salvador, who moved into the Downtown and North Side neighborhoods. Meanwhile, the Black population, which had peaked at around 22% in the 1980s, began a slow decline as manufacturing jobs vanished and families moved to more affordable suburbs like North Chicago and Zion. The Asian population grew modestly, with East/Southeast Asian communities (3.6%) concentrated in the Washington Park area, and a smaller Indian-subcontinent population (2.4%) scattered across the city’s newer housing stock near the lakefront. The white population, which was over 80% in 1970, collapsed to 18.1% by 2024, a demographic shift driven by both out-migration and the arrival of new immigrant groups.
The future
Waukegan’s population is heading toward further Hispanicization, with the Hispanic share projected to exceed 65% by 2035 based on current birth rates and immigration patterns. The city is not homogenizing, however; it is tribalizing into distinct enclaves. Mexican and Puerto Rican communities remain the largest and most established, but they are increasingly separated by neighborhood: the South Side is heavily Mexican, while the North Side and Downtown have a growing Central American presence. The Black population is plateauing at around 15%, with younger families moving to the West Side, where housing is cheaper. The East/Southeast Asian and Indian-subcontinent populations are small but stable, concentrated in the Washington Park and lakefront areas, and are unlikely to grow significantly due to the city’s limited professional job base. The white population will continue to shrink, likely falling below 15% within a decade, as older residents age out and younger families do not replace them. The city’s college-educated share of 21.0% is low, and without a major employer shift toward knowledge industries, Waukegan will remain a working-class, immigrant-heavy city. The next 10-20 years will see continued population growth driven by natural increase among Hispanic families, but the city will struggle with poverty and underemployment unless it diversifies its economy beyond logistics and healthcare.
For someone moving in now, Waukegan is a city of strong ethnic identity and community networks, but with limited upward mobility for those without existing family or job connections. It is a place where new immigrants find a foothold, but where the middle class—of any background—often leaves for the suburbs. The city is becoming more Hispanic, more working-class, and more segregated by neighborhood, making it a challenging but authentic entry point into the American economy for those willing to navigate its distinct enclaves.
* Values derived from national, state, county, city and local statistics and may differ in a specific area. Last updated: 2026-04-29T21:23:45.000Z
Narrative content on this page is AI-generated and may contain mistakes. Verify any details that matter before acting on them.
ReloMaps may earn a commission from affiliate links at no extra cost to you.