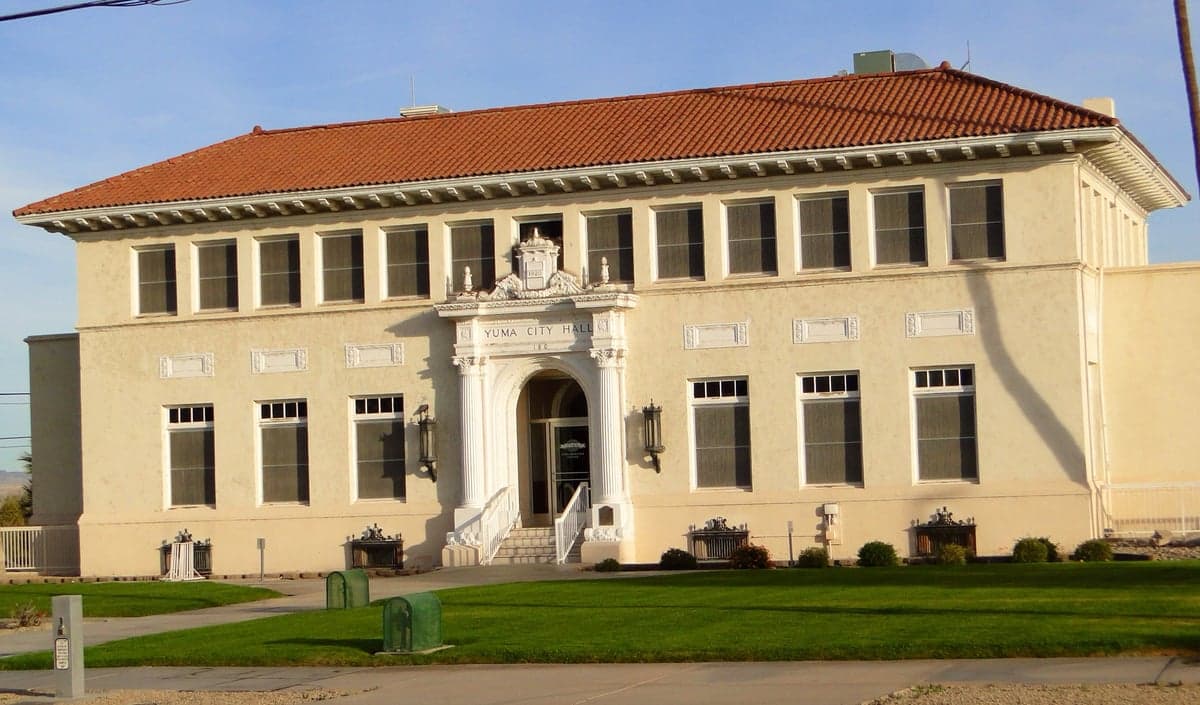
Photo: Wikipedia
Demographics of Yuma, AZ
Affluence Level in Yuma, AZ
A middle-class area roughly in line with national averages across income, home values, education, and employment.
People of Yuma, AZ
The people of Yuma, Arizona, today number 98,461, forming a majority-Hispanic city (61.1%) with a significant White minority (31.4%) and small but established East/Southeast Asian (1.7%) and Black (1.7%) communities. The city’s identity is shaped by its border location, agricultural roots, and military presence, giving it a distinctive blend of long-settled families, seasonal farmworkers, and a transient military population. With only 20.5% of adults holding a college degree, Yuma’s workforce is heavily blue-collar, anchored by the Marine Corps Air Station and a vast winter vegetable industry. The population is notably dense for its size, packed into a narrow Colorado River valley where neighborhoods often reflect the era and ethnic group that built them.
How the city was settled and grew
Yuma’s modern population history begins not with Spanish missions but with the railroad and irrigation. The Southern Pacific Railroad arrived in 1877, and the federal government’s 1901 Yuma Project—one of the first large-scale Bureau of Reclamation irrigation schemes—turned the surrounding desert into some of the most productive farmland in the country. The original Anglo settlers, largely from the Midwest and South, established the Historic Downtown and the Yuma Crossing area, building the first commercial blocks and churches. Mexican laborers, drawn by railroad construction and later by the cotton and lettuce harvests, settled in what became Barrio Logan and the South Yuma neighborhoods, creating tight-knit colonias that predate modern zoning. By 1950, the population was roughly 60% Anglo and 40% Hispanic, with a small Chinese community—descendants of railroad workers—living near Main Street. The 1950s brought the Marine Corps Air Station, which anchored a new wave of military families, mostly White and Black, who settled in the Foothills area west of the city.
Modern era (post-1965)
The 1965 Hart-Cellar Act ended the Bracero program and shifted immigration patterns, but Yuma’s Hispanic population continued to grow through chain migration from Sonora and Sinaloa, Mexico. By 1990, the city was roughly 50% Hispanic; by 2020, it had crossed 60%. The East Yuma neighborhoods, particularly around 24th Street and Avenue A, absorbed much of this growth, with new subdivisions filling in former farmland. The White population, meanwhile, aged in place in the Foothills and Rancho Mesa Verde areas, while younger Anglos increasingly left for college and did not return. The East/Southeast Asian community—primarily Filipino families connected to the military and a smaller Vietnamese group—grew modestly, concentrated near the air station and in the Palm Canyon area. The Black population, at 1.7%, remains largely military-affiliated, with little civilian settlement. The foreign-born share, at 8.8%, is lower than many border cities, reflecting the fact that most Hispanic growth now comes from U.S.-born children of earlier immigrants.
The future
Yuma’s population is likely to continue its gradual Hispanicization, with the White share projected to fall below 25% by 2040 as older residents pass away and few new Anglo families move in. The city is not tribalizing into distinct ethnic enclaves—most neighborhoods are already mixed, with the exception of the heavily White Foothills—but it is homogenizing along class lines: the poor and working-class are overwhelmingly Hispanic, while the small professional class is disproportionately White and military. The East/Southeast Asian community is stable but not growing, as military basing shifts reduce Filipino presence. The Indian-subcontinent population (0.2%) is negligible and concentrated among a handful of medical professionals at Yuma Regional Medical Center. The next decade will likely see continued population growth—Yuma County is projected to add 30,000 residents by 2040—driven by natural increase among Hispanic families and some in-migration from California retirees seeking lower costs. The city will remain a blue-collar, family-oriented border town, with little of the gentrification or white-collar influx seen in Phoenix or Tucson.
For someone moving to Yuma now, the city offers a stable, majority-Hispanic community with strong family networks, a low cost of living, and a culture shaped by agriculture and the military. The population is not diversifying in the way many Sun Belt cities are—it is becoming more uniformly Hispanic and working-class. New arrivals should expect a place where Spanish is heard as often as English, where the economy revolves around winter vegetables and the air station, and where the social fabric is built around church, family, and high school sports rather than the professional-class amenities of larger metros.
* Values derived from national, state, county, city and local statistics and may differ in a specific area. Last updated: 2026-04-19T08:09:01.000Z
Narrative content on this page is AI-generated and may contain mistakes. Verify any details that matter before acting on them.
ReloMaps may earn a commission from affiliate links at no extra cost to you.