Photo: Wikipedia
Demographics of Arlington, TX
Affluence Level in Arlington, TX
A middle-class area roughly in line with national averages across income, home values, education, and employment.
People of Arlington, TX
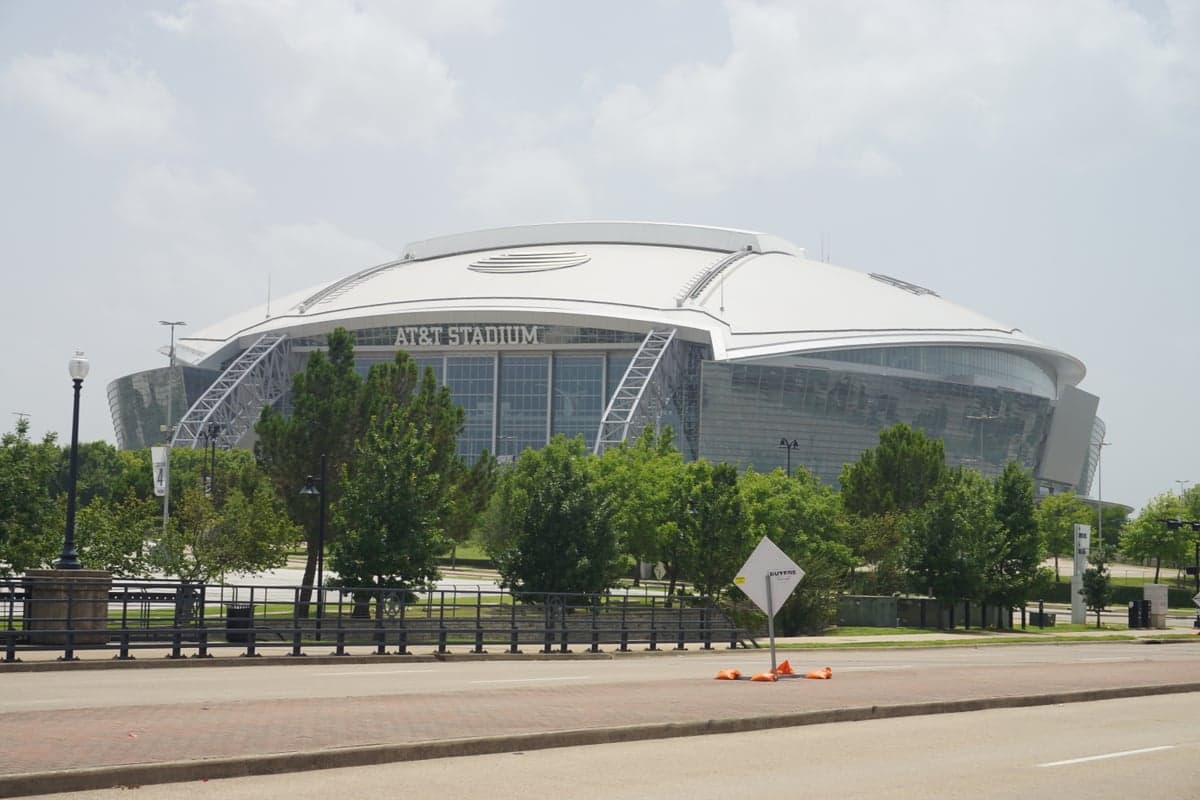
The people of Arlington, Texas today number 394,769, forming a dense, majority-minority city where no single racial or ethnic group holds a numerical majority. White residents make up 35.8% of the population, Hispanic residents 31.0%, and Black residents 21.9%, creating a tripartite demographic structure that is unusual even for the diverse Dallas-Fort Worth metroplex. The city is also home to a notable East and Southeast Asian community (5.4%) and a smaller Indian-subcontinent population (1.8%), with 12.6% of residents foreign-born. Arlington is a working-to-middle-class city with a strong suburban identity, anchored by the University of Texas at Arlington and major entertainment venues like AT&T Stadium and Globe Life Field, but its population character is increasingly shaped by the distinct neighborhoods and corridors where these groups have settled over successive waves of migration.
How the city was settled and grew
Arlington was founded in 1876 as a railroad stop on the Texas and Pacific Railway, drawing its earliest settlers from the American South and Midwest. The original population was overwhelmingly white and Protestant, with many families arriving from Tennessee, Kentucky, and Missouri to farm cotton and corn. The city incorporated in 1884 with fewer than 1,000 residents. The first significant non-white population arrived during the Great Migration (roughly 1910–1940), when Black families moved from rural East Texas to work in the area’s cotton gins, rail yards, and emerging brick plants. These families settled in what became the historic Johnson Creek neighborhood, a Black enclave near the railroad tracks south of downtown, and in the East Arlington area along Division Street. By 1950, Arlington’s population had reached just 7,692, and the city remained a small, segregated farming town. The post-World War II boom changed everything: the opening of the General Motors Arlington Assembly plant in 1954 and the establishment of the University of Texas at Arlington (then Arlington State College) drew thousands of white middle-class families from across the South and Midwest. These newcomers filled new subdivisions like Dalworthington Gardens (a separately incorporated city within Arlington’s footprint) and the Green Oaks area in north Arlington, which became solidly white and affluent through the 1960s and 1970s.
Modern era (post-1965)
The 1965 Hart-Cellar Immigration Act and the broader suburbanization of the Dallas-Fort Worth metroplex reshaped Arlington’s population dramatically after 1970. The city’s Hispanic population began growing rapidly in the 1970s and 1980s, driven by immigration from Mexico and Central America and by domestic migration from South Texas. These families concentrated in South Arlington, particularly along the Pioneer Parkway corridor and in the Meadowbrook area, where affordable housing and proximity to construction and service jobs created a stable Hispanic-majority zone. The Black population also expanded significantly during this period, as middle-class Black families moved from Dallas and Fort Worth into Arlington’s East Arlington neighborhoods, especially around Park Row and Arkansas Lane. By 1990, Arlington was roughly 70% white, 15% Black, and 10% Hispanic. The 1990s and 2000s saw the white share decline steadily as Hispanic and Asian immigration accelerated. East and Southeast Asian communities—primarily Vietnamese, Filipino, and Korean families—settled in North Arlington near the Collins Street corridor, drawn by the area’s good schools and proximity to high-tech jobs in Las Colinas and Dallas. The Indian-subcontinent population, though smaller, grew in the same north Arlington neighborhoods and in the Viridian master-planned community near Lake Arlington. The 2020 Census confirmed Arlington as a majority-minority city for the first time, with white residents falling below 40%.
The future
Arlington’s population is likely to continue diversifying, but the city is not homogenizing into a single melting pot. Instead, distinct ethnic enclaves are solidifying: South Arlington is becoming more heavily Hispanic, East Arlington remains the historic Black center, and North Arlington is the primary gateway for Asian and Indian families. The foreign-born share (12.6%) is below the national average (13.7%) and is growing slowly, suggesting that future demographic change will come more from domestic migration and natural increase than from new immigration. The Hispanic population is the fastest-growing segment, driven by high birth rates and continued in-migration from South Texas and Mexico, and is projected to approach 40% of the city by 2035. The white population is aging and declining in absolute numbers, while the Black share has stabilized. The East and Southeast Asian and Indian populations are growing but from a small base and are unlikely to exceed 10% combined in the next decade. Arlington is becoming a city where three large groups—white, Hispanic, and Black—coexist in roughly equal measure, with smaller Asian and Indian communities concentrated in specific northern neighborhoods.
For someone moving to Arlington now, the city offers a genuinely diverse, middle-class environment where no single group dominates. The practical implication is that neighborhood choice matters more than citywide averages: a family moving to South Arlington will find a heavily Hispanic, Spanish-bilingual community, while a buyer in North Arlington will encounter a more mixed, Asian-influenced suburban landscape. The city’s political and civic culture is increasingly shaped by this tripartite demographic reality, with coalition-building across racial lines becoming the norm in local elections and school board races. Arlington is not a city of extremes—it is a solidly middle-income, family-oriented place where demographic change is steady but not disruptive, and where the population is becoming more diverse in a measured, organic way.
* Values derived from national, state, county, city and local statistics and may differ in a specific area. Last updated: 2026-04-21T17:42:34.000Z
Narrative content on this page is AI-generated and may contain mistakes. Verify any details that matter before acting on them.
ReloMaps may earn a commission from affiliate links at no extra cost to you.