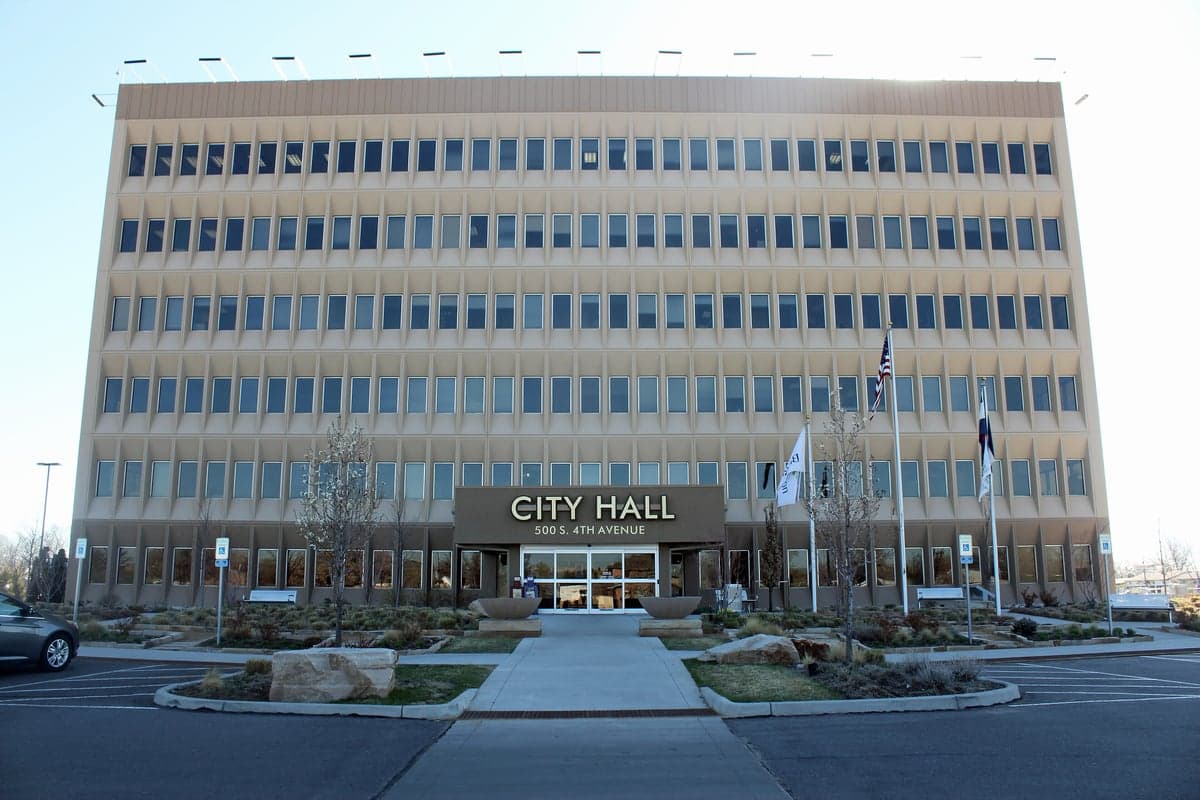
Photo: Wikipedia
Quality of Life in Brighton, CO
A high quality of life with strong walkability, manageable living costs, healthy neighborhood signals, and solid amenity access.
What does Quality of Life tell us?
Quality of Life blends cost of living, nearby amenities, socioeconomic signals, and neighborhood character. City-level scores represent the whole municipality; individual neighborhoods can differ.
What does this tell us?
Quality of Life blends cost of living, nearby amenities, socioeconomic signals, and neighborhood character. City-level scores represent the whole municipality; individual neighborhoods can differ.
Cost of Living
57% above national average
The Real Cost of Living in Brighton, CO for 2026
| Tier | Individual | Family (4) |
|---|---|---|
| Survival | $28k | $52k |
| Comfortable | $92k | $136k |
| Luxury | $149k+ | $231k+ |
| Elite (Top 5%) | $175k+ | $272k+ |
74%
The Area Signal
A metric tracking the socioeconomic signals of the area.
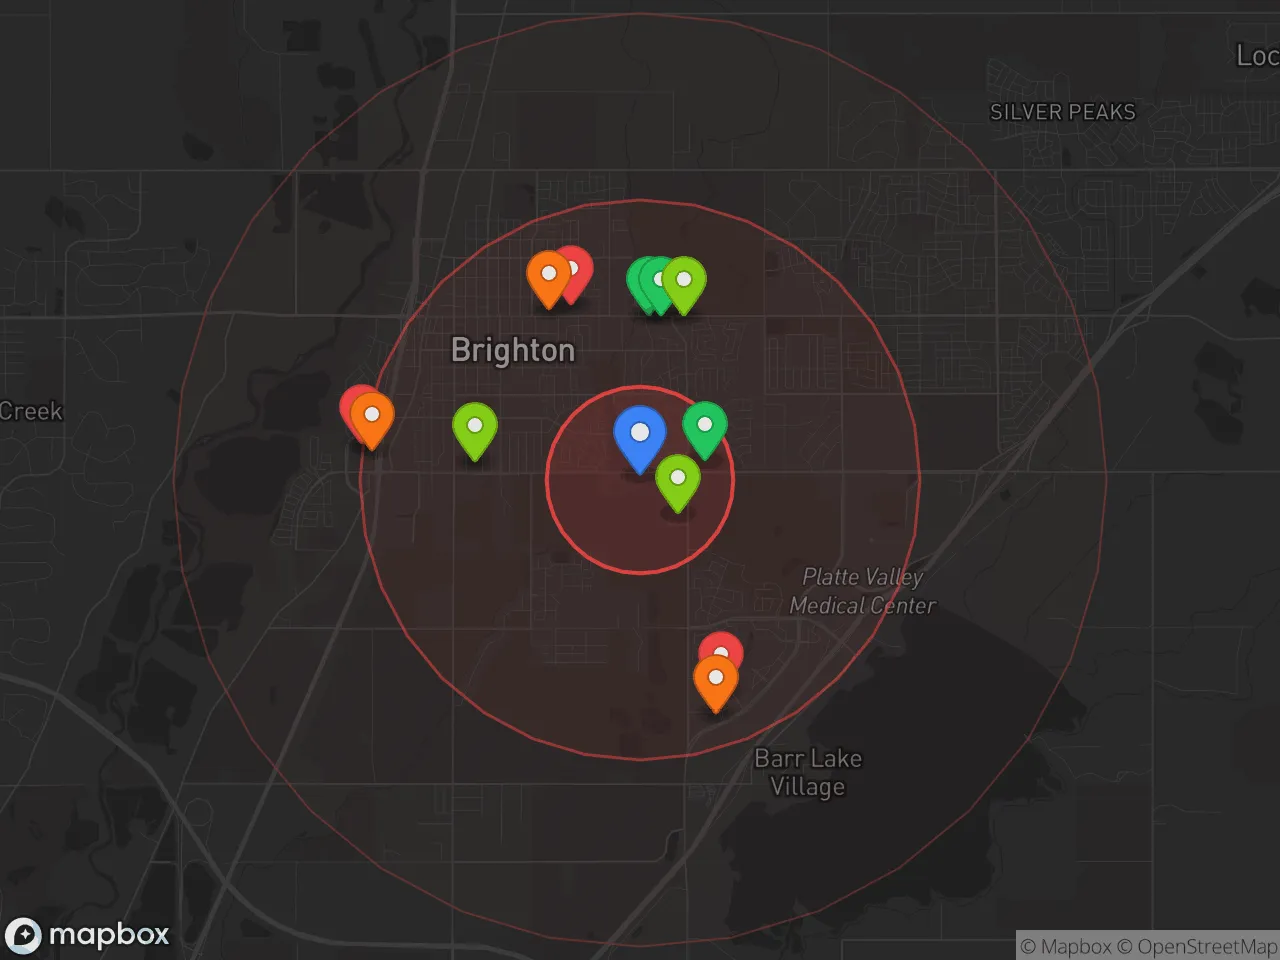
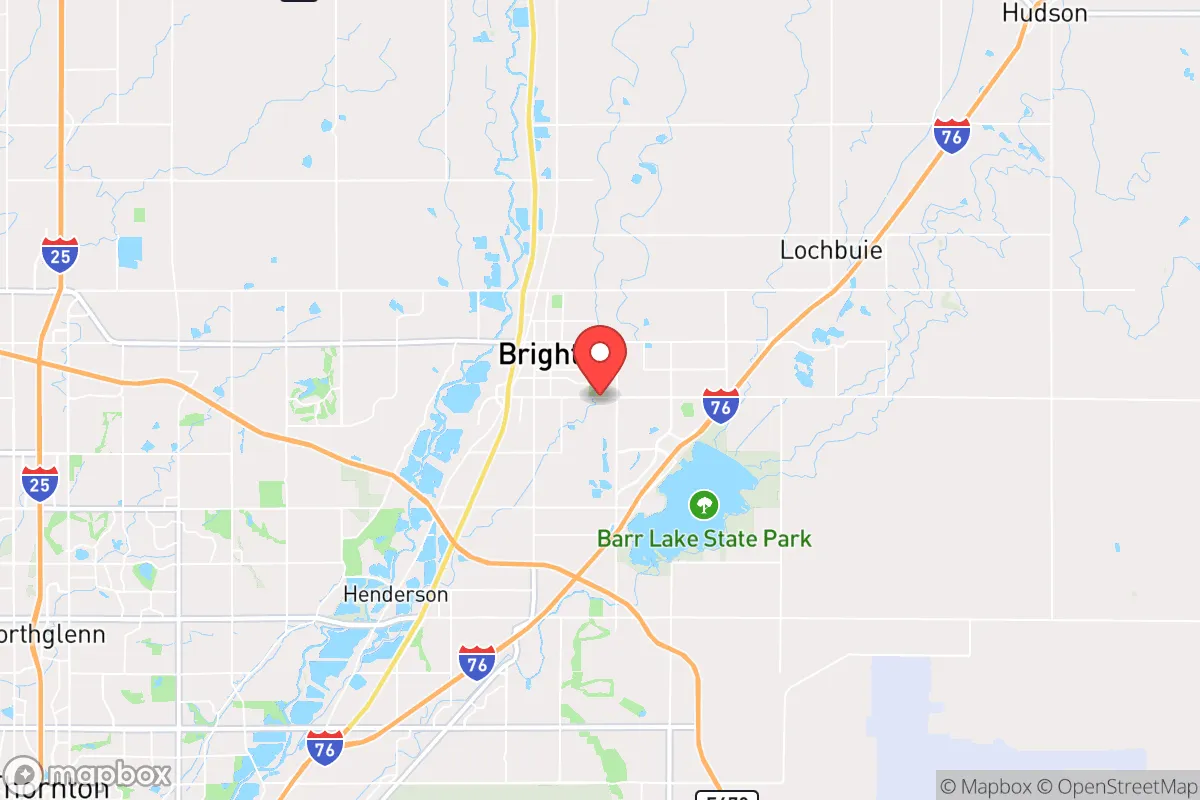
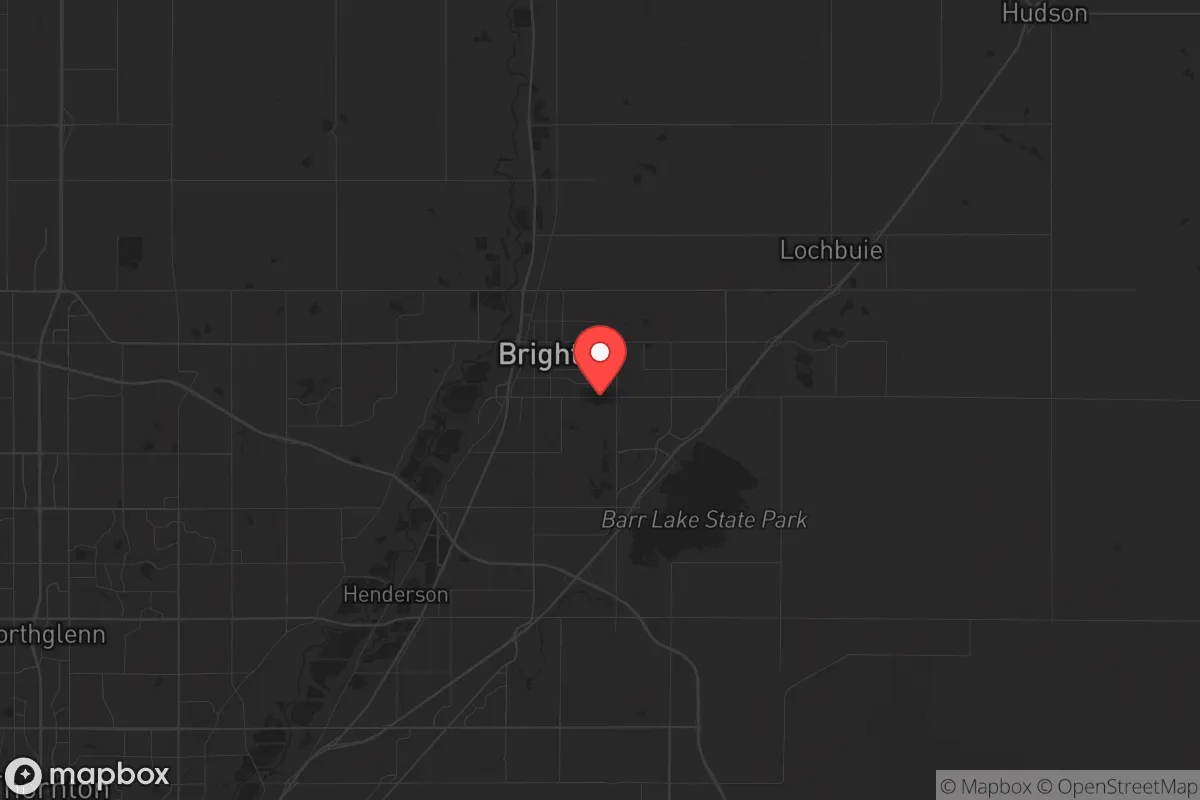
Hobbies
Explore the areaGroceries
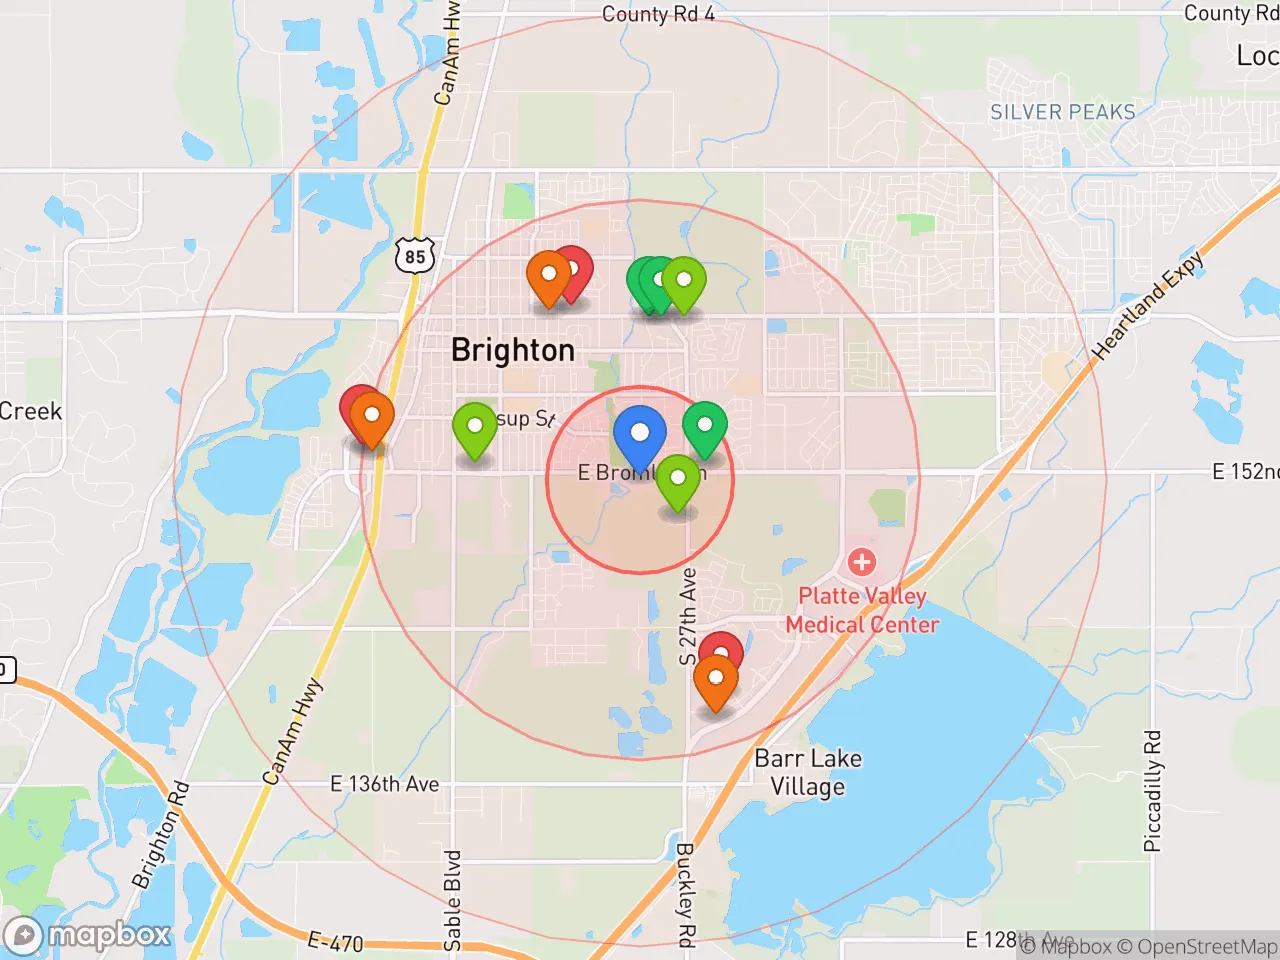
5 within 10 miles
Gas
20 within 10 miles
Hospital
20 within 20 miles
Airport
DEN — Denver International
Post Office
USPS — Brighton, CO
Critical Amenities
Quality-of-Life Analysis
Brighton, Colorado, presents a quality of life shaped by its position as an affluent, rapidly growing suburb within the Denver-Aurora-Lakewood metropolitan area. With a cost of living index of 157 (significantly above the U.S. average of 100), the city attracts a demographic mix of professionals, families, and long-term residents who value newer housing stock, lower density compared to central Denver, and proximity to both Front Range employment hubs and Rocky Mountain recreation. The population skews toward middle-to-upper income brackets, with a notable presence of workers in healthcare, logistics, and energy sectors, as well as commuters who trade a longer drive for more space.
How housing costs and affordability compare to Denver and surrounding suburbs
Brighton’s housing market reflects its status as a more affordable alternative to Denver proper, though costs have risen sharply in recent years. The median home value sits at $475,100, which is roughly 15% lower than the Denver metro median but still well above the national figure. Median rent is $1,734, offering a slight discount compared to nearby suburbs like Broomfield or Westminster, where rents often exceed $1,900. However, the overall cost of living index of 157 means everyday expenses—groceries, utilities, transportation—are substantially higher than the U.S. average. For buyers, the trade-off is clear: newer construction and larger lots in Brighton versus older, pricier homes closer to downtown Denver. The average commute time of 30.6 minutes is manageable by metro standards, with most residents driving to jobs in Denver, Aurora, or the Interstate 76 corridor. Those working in Brighton itself—at the Platte Valley Medical Center or local distribution centers—enjoy a significantly shorter drive.
What daily life is like for families: schools, parks, and local amenities
Daily life in Brighton centers on a blend of suburban convenience and small-town character, supported by the School District 27J, which serves Brighton, Henderson, and parts of unincorporated Adams County. The district has invested in new facilities, including Brighton High School and several elementary schools, though performance ratings vary by school. Families frequently use the city’s extensive park system—Bromley Park and the Brighton Oasis Family Aquatic Park are popular—and the nearby Barr Lake State Park offers hiking, birding, and fishing within a 15-minute drive. Retail and dining are concentrated along Bridge Street and at the Brighton Marketplace, with national chains dominating but a few local spots like the Brick Oven Pizza Company providing community anchors. For entertainment, residents often drive 25–30 minutes into Denver for museums, concerts, and professional sports, though the city’s own events—such as the Brighton Harvest Festival and the Adams County Fair—foster a local social rhythm. The absence of a major transit hub means a car is essential, and traffic on Highway 85 can back up during peak hours.
Brighton is best suited for families and professionals who prioritize newer housing, lower density, and a slower pace than central Denver, while still needing access to metro-area jobs and amenities. The higher cost of living is offset by home values that remain below many Front Range suburbs, and the 30-minute commute is a reasonable trade-off for those who value space over walkability. Retirees on fixed incomes may find the cost index challenging, but for dual-income households or those working in Brighton’s growing healthcare and logistics sectors, the city offers a stable, family-oriented environment with room to grow.
Crime in Brighton, CO
Higher crime rates than 62% of comparable U.S. locations.
Violent CrimeViolent Crime Analysis
Property CrimeProperty Crime Analysis
Crime Analysis
Brighton, Colorado, reports a violent crime rate of 487.5 incidents per 100,000 residents and a property crime rate of 2,367.6 per 100,000, placing it above both state and national averages for overall crime. As a growing city within the Denver-Aurora-Lakewood metropolitan area, Brighton faces safety challenges common to many Front Range communities, though its specific rates warrant careful consideration for potential residents. The city’s proximity to a large, progressive metro area means that local law enforcement operates within a broader judicial environment that often prioritizes rehabilitation over incarceration, a factor that directly impacts public safety outcomes.
Crime in context
Brighton’s violent crime rate of 487.5 per 100,000 is roughly 40% higher than the national average of approximately 380 per 100,000 and significantly exceeds Colorado’s state average of about 410 per 100,000. Property crime in Brighton, at 2,367.6 per 100,000, is nearly 60% above the national average of roughly 1,950 per 100,000 and well above Colorado’s state figure of around 2,100 per 100,000. These elevated numbers reflect a broader trend in the Denver metro region, where progressive district attorneys in Adams County—which encompasses Brighton—have implemented policies such as reduced cash bail, declination to prosecute certain low-level offenses, and diversion programs. While intended to reduce incarceration rates, these policies have been linked to higher recidivism and a greater number of offenders remaining on the street, directly increasing the risk to law-abiding residents and victims of crime.
What residents experience
For those living in Brighton, the elevated crime rates translate into tangible daily concerns. Property crimes—including theft, burglary, and motor vehicle theft—are the most common, with residents frequently reporting stolen packages, vehicle break-ins, and vandalism. Violent incidents, while less frequent, include aggravated assault and robbery, often concentrated in areas with higher population density or near commercial corridors like Highway 85. The progressive judicial approach in Adams County means that even when arrests are made, offenders often face minimal consequences, with many released on personal recognizance or given short sentences. This cycle frustrates residents who see the same individuals reoffending, eroding trust in the justice system and creating a sense of impunity among criminals.
Neighborhood-level variation exists, with newer developments on the city’s east side—such as those near Bromley Lane—tending to report lower crime rates than older, more established areas near downtown Brighton and the South Platte River corridor. However, the overall trend is one of rising property crime and persistent violent crime, driven in part by the metro area’s lenient criminal justice policies. For families and individuals prioritizing safety, Brighton’s crime statistics and its location within a progressive judicial district represent a significant drawback that should be weighed carefully against the city’s lower housing costs and suburban amenities.
* Values derived from national, state, county, city and local statistics and may differ in a specific area. Last updated: 2026-05-01T10:55:43.000Z
Narrative content on this page is AI-generated and may contain mistakes. Verify any details that matter before acting on them.
ReloMaps may earn a commission from affiliate links at no extra cost to you.