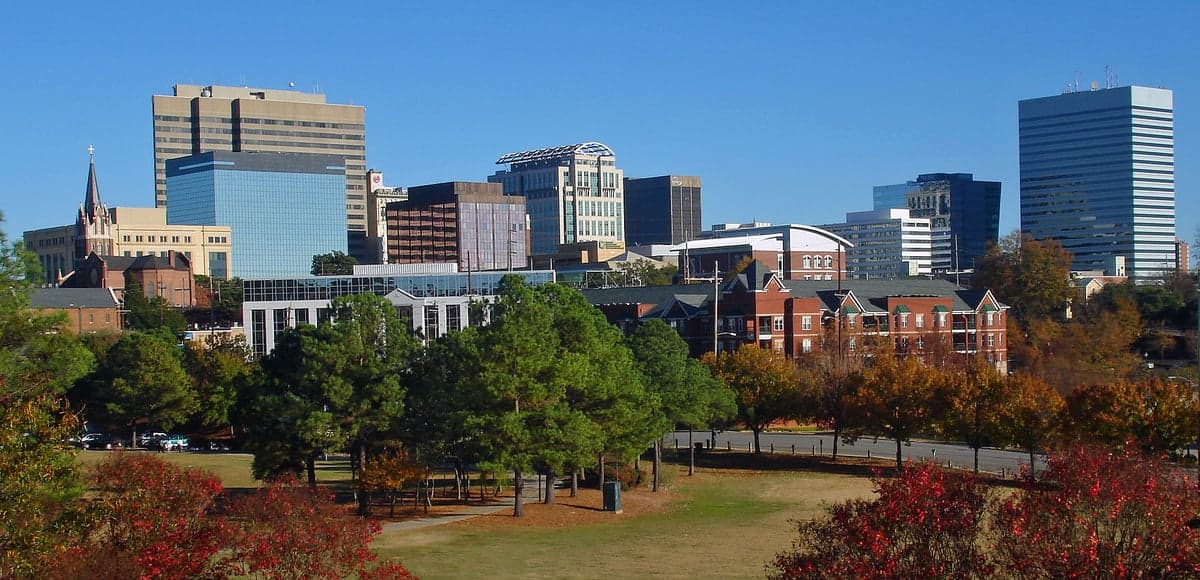
Photo: Wikipedia
Quality of Life in Columbia, SC
A high quality of life with strong walkability, manageable living costs, healthy neighborhood signals, and solid amenity access.
What does Quality of Life tell us?
Quality of Life blends cost of living, nearby amenities, socioeconomic signals, and neighborhood character. City-level scores represent the whole municipality; individual neighborhoods can differ.
What does this tell us?
Quality of Life blends cost of living, nearby amenities, socioeconomic signals, and neighborhood character. City-level scores represent the whole municipality; individual neighborhoods can differ.
Cost of Living
6% below national average
The Real Cost of Living in Columbia, SC for 2026
| Tier | Individual | Family (4) |
|---|---|---|
| Survival | $18k | $35k |
| Comfortable | $47k | $70k |
| Luxury | $101k+ | $156k+ |
| Elite (Top 5%) | $170k+ | $264k+ |
80%
The Area Signal
A metric tracking the socioeconomic signals of the area.
Hobbies
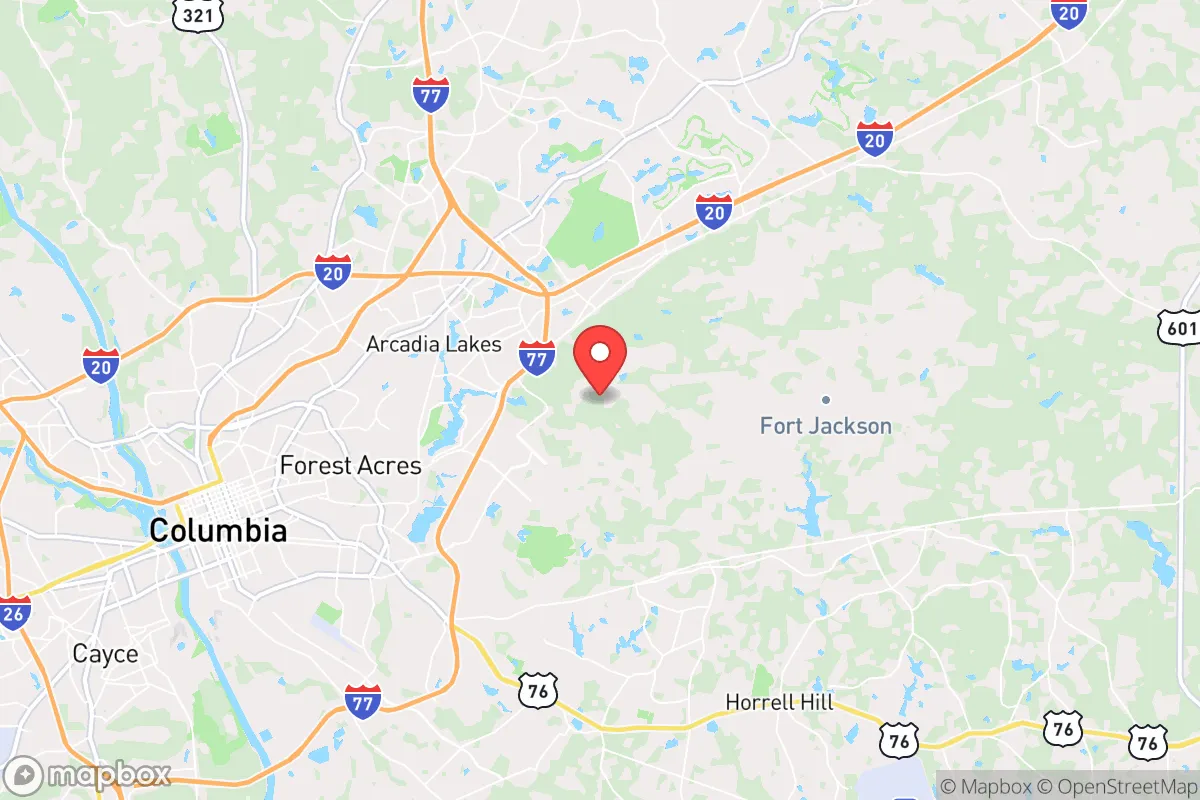
Explore the areaGroceries
7 within 10 miles
Gas
20 within 10 miles
Hospital
15 within 20 miles
Airport
CLT — Charlotte Douglas International
Post Office
USPS — Columbia, SC
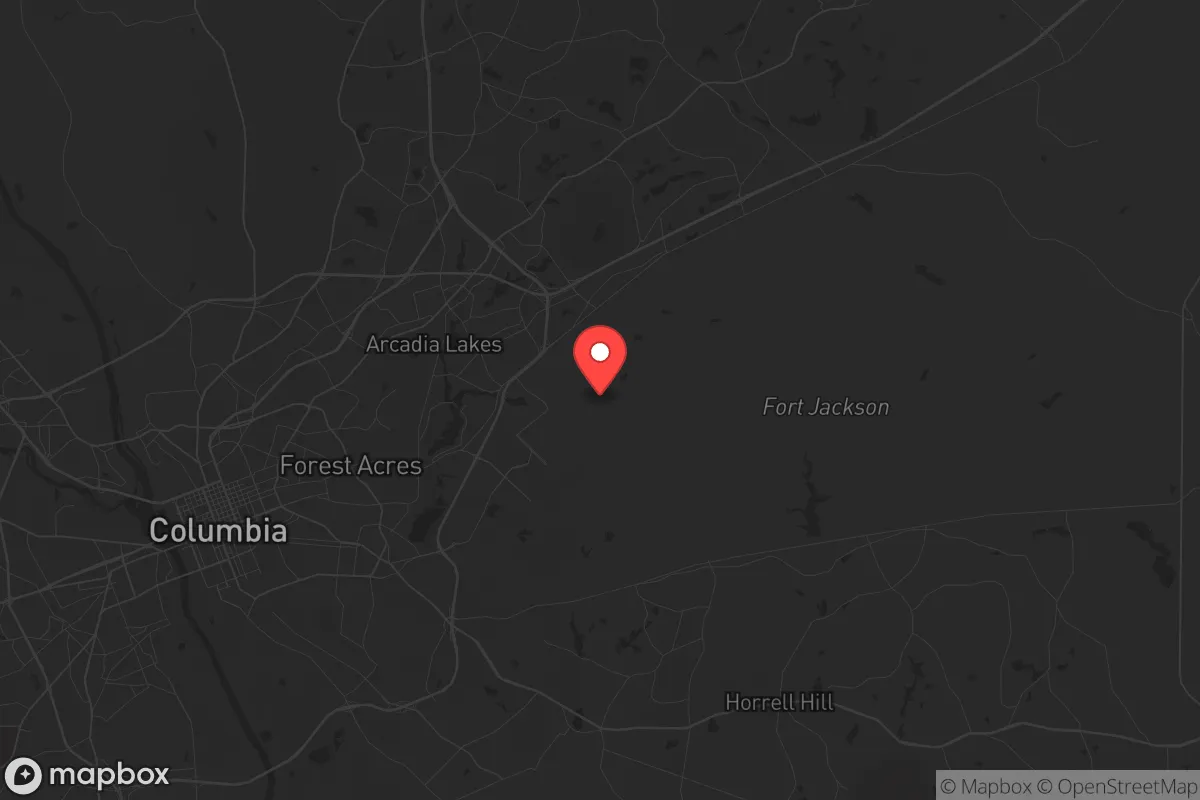
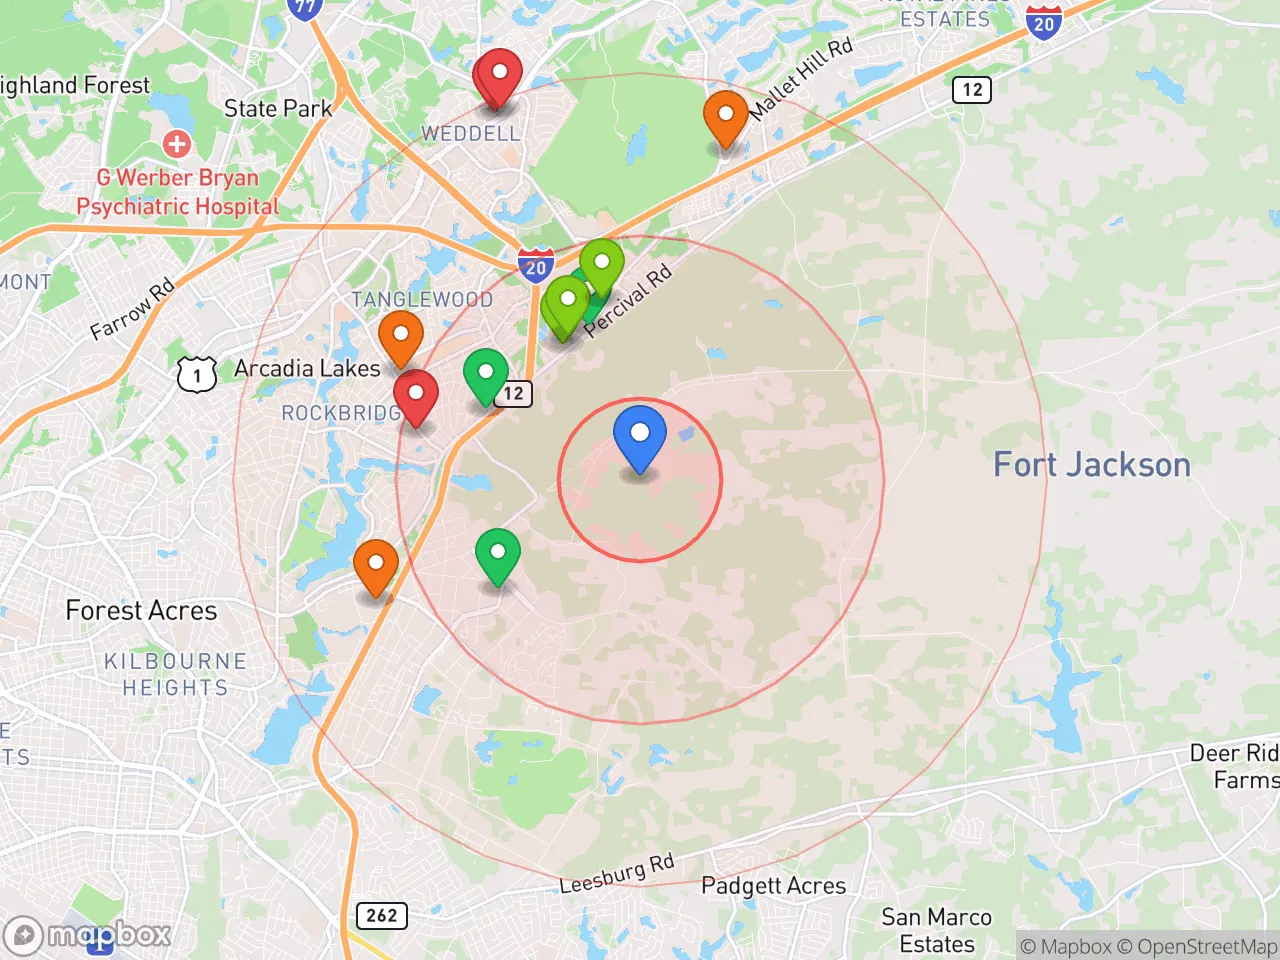
Critical Amenities
Quality-of-Life Analysis
Columbia, South Carolina, offers a quality of life defined by a cost of living 6% below the national average, attracting a diverse mix of state government employees, University of South Carolina faculty and students, and young professionals seeking an affordable urban core. The city’s median household income hovers around $52,000, reflecting a community that is more middle-income than affluent, with a significant population of renters and first-time homebuyers drawn by the region’s economic stability and Southern charm. Unlike the fast-growing coastal cities of Charleston or Greenville, Columbia maintains a slower, more grounded pace, appealing to those who prioritize financial breathing room over high-end luxury.
Cost of living, housing affordability, and how Columbia compares to nearby cities
With a cost-of-living index of 94 (100 = U.S. average), Columbia is notably cheaper than Charleston (index 108) and Greenville (index 97), while remaining slightly more expensive than rural towns like Sumter (index 88). The median home value of $243,500 is roughly $60,000 below the national median, making homeownership attainable for many dual-income households. Renters face a median monthly rent of $1,158, which is about $200 less than the national average and significantly lower than the $1,500+ typical in Charleston’s metro area. The average commute of just 17.4 minutes is among the shortest for any state capital in the Southeast, reducing transportation costs and freeing up time for family or leisure. Property taxes in Richland County average around 0.6% of home value, further lowering the total cost of ownership compared to states like Texas or Florida.
Daily life, schools, and what makes the city’s rhythm unique
Columbia’s daily rhythm is shaped by its role as a college town and state capital, with the University of South Carolina’s 35,000 students injecting energy into the Five Points and Vista districts. The city’s public schools, part of Richland School District One and Two, include magnet programs like A.C. Flora High School and Dreher High School, which consistently rank among the state’s top 20. For families, the Riverbanks Zoo and Garden and the Congaree National Park (just 20 minutes southeast) provide accessible outdoor recreation. The culinary scene leans toward Southern comfort staples—barbecue at Little Pigs, shrimp and grits at Motor Supply Co. Bistro—with a growing number of farm-to-table options. The city’s walkability is limited to downtown corridors; most residents rely on cars, though the COMET bus system serves key routes. Healthcare is anchored by Prisma Health Richland Hospital and the VA Medical Center, both major employers.
Columbia is best suited for individuals and families who value affordability, short commutes, and a relaxed Southern lifestyle over the fast-paced amenities of larger metros. It works well for state workers, university affiliates, and remote professionals who want a lower cost of living without sacrificing access to a capital city’s cultural and educational resources. Those seeking high-end shopping, nightlife, or coastal proximity may find the city underwhelming, but for budget-conscious newcomers who prioritize financial stability and a manageable daily routine, Columbia delivers a solid, grounded quality of life.
Crime in Columbia, SC
Significantly higher crime rates than 76% of comparable U.S. locations.
Violent CrimeViolent Crime Analysis
Property CrimeProperty Crime Analysis
Crime Analysis
Columbia, South Carolina, reports a violent crime rate of 370.4 incidents per 100,000 residents and a property crime rate of 3,143.8 per 100,000, placing it above both the national average and the state average for overall crime. While the city has seen some localized safety improvements in recent years, its crime statistics remain a significant concern for prospective residents, particularly when compared to smaller suburban communities in the surrounding Richland and Lexington counties. The overall safety picture is one of a mid-sized capital city where crime is concentrated in specific areas, and where the local criminal justice system's approach has a direct impact on public safety outcomes.
Crime in context
Columbia's violent crime rate of 370.4 per 100,000 is roughly 1.5 times the national average and significantly higher than the South Carolina state average of approximately 290 per 100,000. Property crime in the city is even more elevated, with a rate of 3,143.8 per 100,000 that is nearly double the national average of around 1,950 per 100,000. These figures place Columbia among the higher-crime cities in the Southeast, though they are comparable to other state capitals like Montgomery, Alabama, and Jackson, Mississippi. A key factor driving these numbers is the prevalence of property offenses—particularly motor vehicle theft and larceny—which are often linked to transient populations and areas with high foot traffic near the University of South Carolina campus and downtown entertainment districts.
What residents experience
Residents report that crime is not evenly distributed, with the most frequent incidents being property-related: car break-ins, package thefts, and burglaries in older neighborhoods near the city core. Violent crime, while less common, is a serious concern, with aggravated assault making up the majority of violent incidents. A critical factor shaping Columbia's safety landscape is the judicial philosophy of local prosecutors. Richland County, which encompasses most of Columbia, has elected progressive district attorneys who prioritize alternatives to incarceration and reduced sentencing for non-violent offenders. While this approach is intended to reduce prison populations, it has a direct and negative consequence: repeat offenders are frequently released back onto the streets, undermining deterrence and increasing the risk of recidivism. This cycle is particularly evident in property crime, where many arrests do not lead to sustained incarceration, emboldening criminals and frustrating victims and law enforcement alike.
Neighborhood-level variation
Safety varies dramatically within Columbia's city limits. The downtown area, including the Vista and Five Points, sees higher rates of theft and occasional violent incidents, especially during late-night hours. In contrast, neighborhoods like Earlewood, Heathwood, and Shandon report lower crime rates, though property crime remains a persistent issue even in these areas. The most significant safety differential exists between Columbia proper and its suburbs. Lexington County communities such as Irmo and Lexington town have violent crime rates below 200 per 100,000, making them substantially safer options for families and professionals. Prospective residents should carefully evaluate specific blocks and apartment complexes, as crime can vary block-by-block, and should factor in the local justice system's leniency when assessing long-term safety risk.
* Values derived from national, state, county, city and local statistics and may differ in a specific area. Last updated: 2026-04-23T04:57:37.000Z
Narrative content on this page is AI-generated and may contain mistakes. Verify any details that matter before acting on them.
ReloMaps may earn a commission from affiliate links at no extra cost to you.