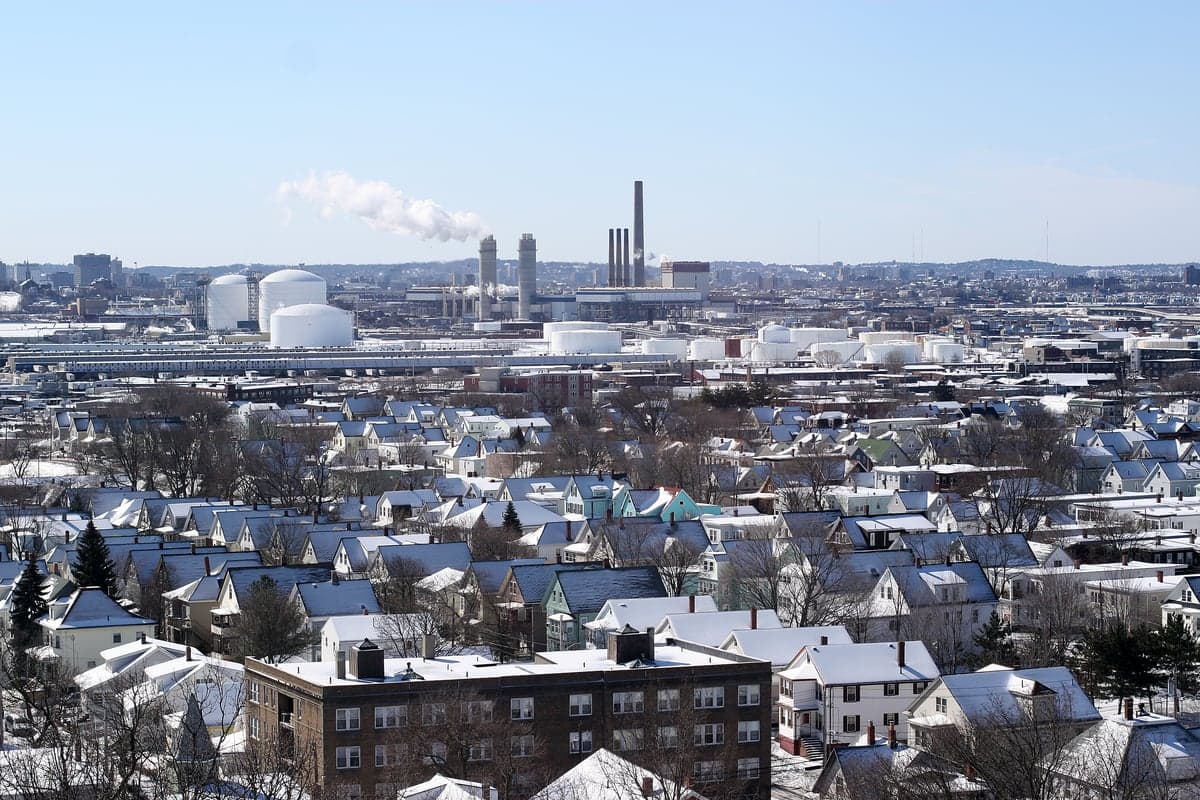
Photo: Wikipedia
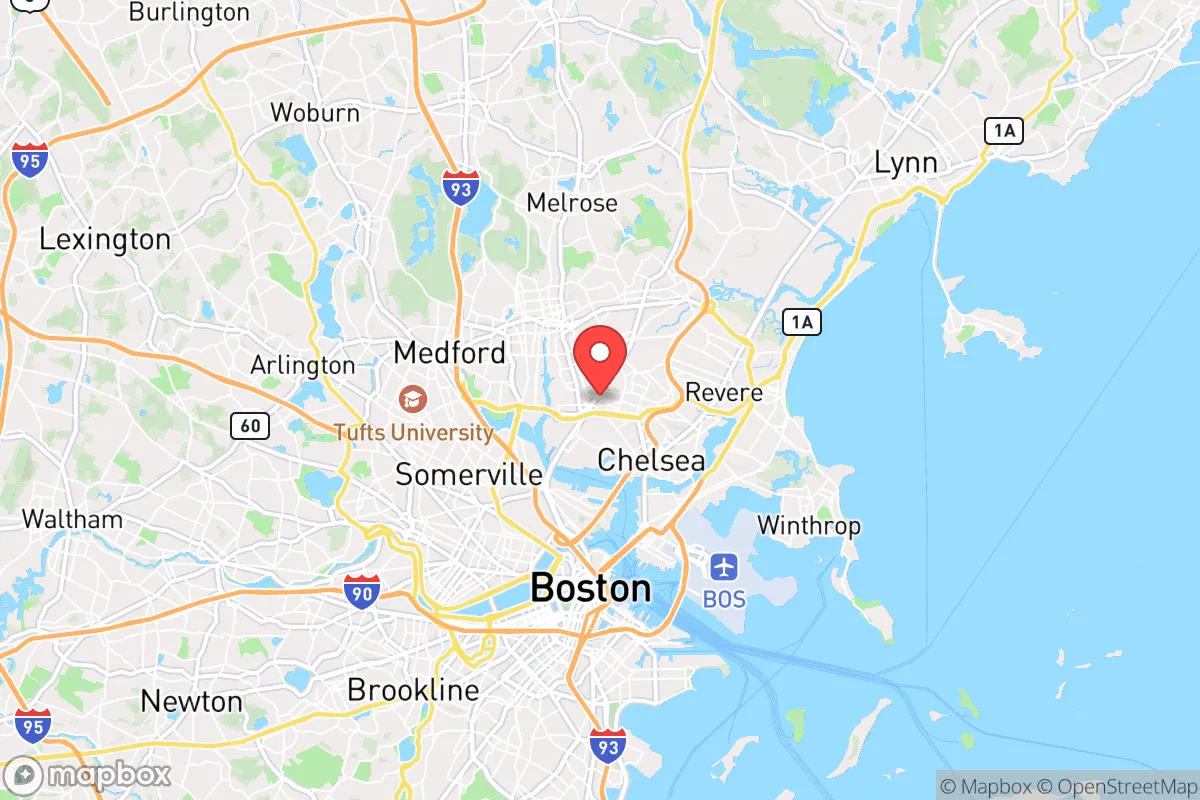
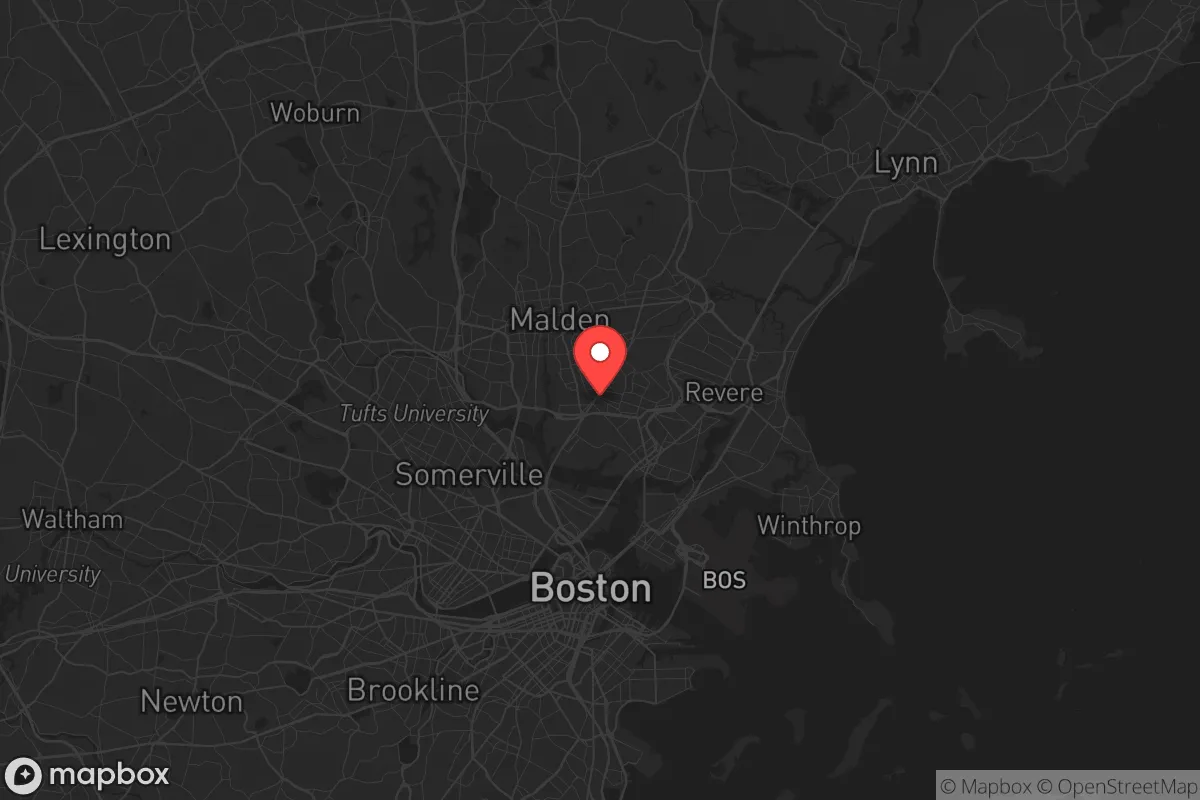
Quality of Life in Everett, MA
Above-average quality of iife. The area offers a reasonable cost of living, decent mobility, and a mix of neighborhood amenities.
What does Quality of Life tell us?
Quality of Life blends cost of living, nearby amenities, socioeconomic signals, and neighborhood character. City-level scores represent the whole municipality; individual neighborhoods can differ.
What does this tell us?
Quality of Life blends cost of living, nearby amenities, socioeconomic signals, and neighborhood character. City-level scores represent the whole municipality; individual neighborhoods can differ.
Cost of Living
88% above national average
The Real Cost of Living in Everett, MA for 2026
| Tier | Individual | Family (4) |
|---|---|---|
| Survival | $32k | $60k |
| Comfortable | $91k | $134k |
| Luxury | $133k+ | $206k+ |
| Elite (Top 5%) | $157k+ | $243k+ |
60%
The Area Signal
A metric tracking the socioeconomic signals of the area.
Hobbies
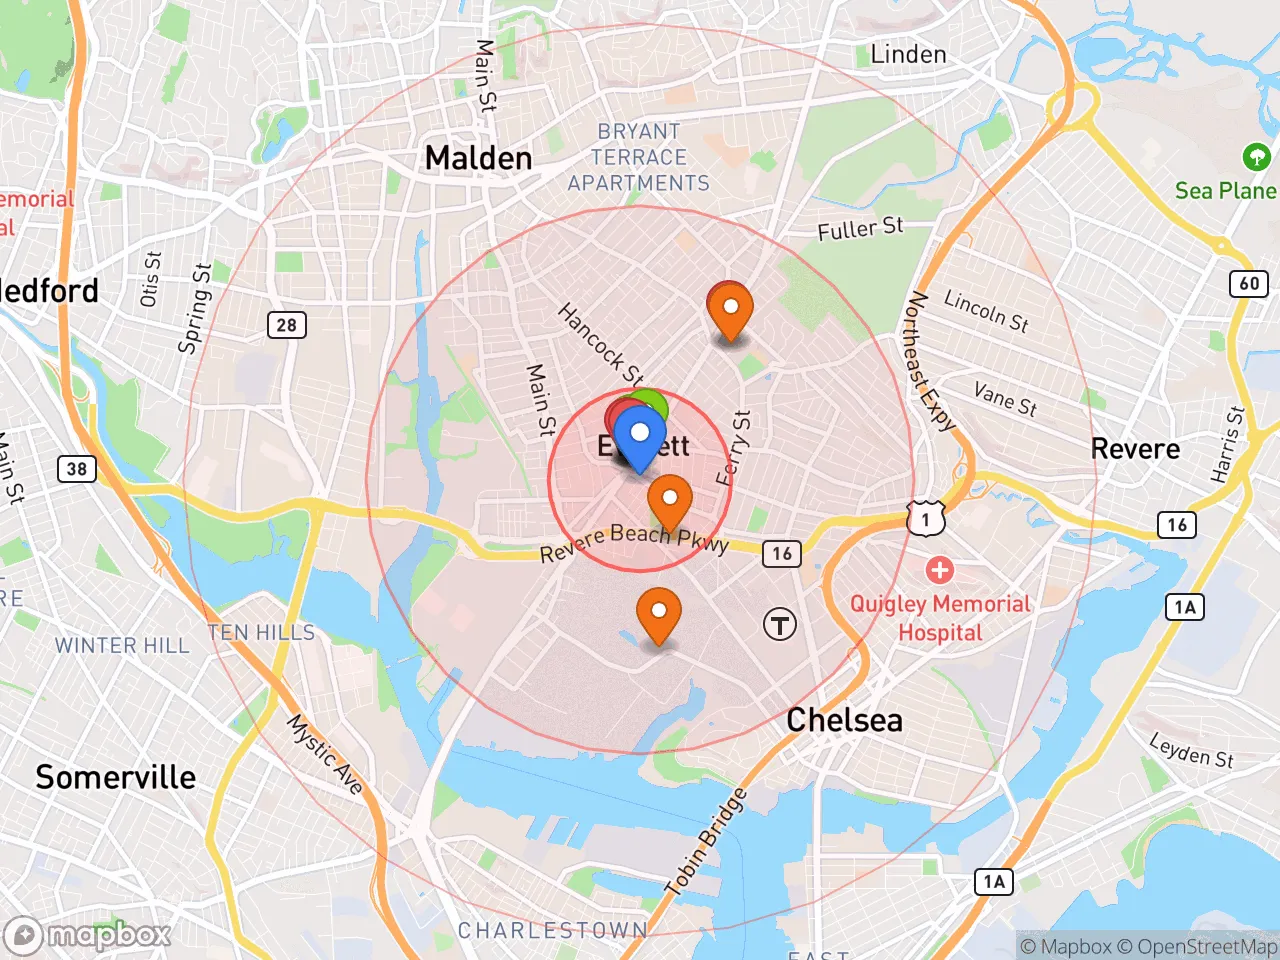
Explore the areaGroceries
8 within 10 miles
Gas
20 within 10 miles
Hospital
20 within 20 miles
Airport
PDX — Portland International Jetport
Post Office
USPS — Everett, MA
Critical Amenities
Quality-of-Life Analysis
Everett, Massachusetts, presents a quality-of-life profile defined by its dense urban character and a cost of living that significantly exceeds national averages, attracting a mix of long-standing immigrant families and young professionals priced out of Boston proper. With a cost of living index of 188 (100 being the U.S. average), the city is notably more affordable than its immediate neighbor Boston, yet remains substantially more expensive than many other parts of the country. The population is predominantly working- and middle-class, with a strong Hispanic and Brazilian community presence that shapes the local culture and small-business landscape.
How housing costs and daily expenses compare to Boston and Somerville
Everett’s housing market reflects its position as a more attainable alternative to Boston and Cambridge, though affordability is relative. The median home value of $605,200 is roughly 40% lower than Boston’s median, but still represents a significant financial commitment for most households. Median rent sits at $1,988, which is about $500 less per month than the Boston average, making it a practical option for renters who need proximity to the city without paying premium prices. However, the overall cost of living index of 188 means that groceries, utilities, and transportation all carry a substantial premium over national norms. The average commute time of approximately 35 minutes is typical for the Greater Boston area, with many residents relying on the MBTA bus system or driving to nearby subway stations in Wellington or Sullivan Square. For those comparing Everett to Somerville or Medford, housing costs are generally 10-15% lower, though the trade-off includes fewer direct transit options and a less walkable downtown core.
What daily life is like for families and professionals in Everett
Daily life in Everett is shaped by its compact, walkable neighborhoods and a strong sense of local community, though amenities are more utilitarian than in wealthier suburbs. The city’s school system, part of the Everett Public Schools district, serves around 7,000 students and has faced challenges with funding and infrastructure, leading many families to consider private or charter options. Parks such as Rivergreen Park and the Northern Strand Community Trail provide recreational space, but the city lacks the large green areas found in towns like Winchester or Arlington. Dining and shopping are concentrated along Broadway and Ferry Street, featuring a mix of Latin American bakeries, Italian delis, and casual restaurants, with fewer high-end options than in neighboring Somerville. For professionals, the short commute to Boston’s employment hubs—including the Seaport District and Kendall Square—is a major draw, though the reliance on bus routes and traffic-prone roadways can be a frustration. The city’s proximity to Logan Airport (about 10 minutes by car) is a practical advantage for frequent travelers, but also brings noise from flight paths over certain neighborhoods.
Everett is best suited for individuals and families who prioritize affordability relative to Boston and value a diverse, community-oriented environment over suburban amenities or top-tier schools. Young professionals working in Boston or Cambridge will find the commute manageable and the rent savings meaningful, while immigrant families may appreciate the established cultural networks and relatively lower home prices. Those seeking excellent public schools, extensive green space, or a quiet suburban lifestyle will likely find Everett’s trade-offs unappealing, but for residents who embrace its urban energy and practical location, the city offers a viable foothold in one of the nation’s most expensive metropolitan areas.
Crime in Everett, MA
Lower crime rates than 79% of comparable U.S. locations.
Violent CrimeViolent Crime Analysis
Property CrimeProperty Crime Analysis
Crime Analysis
Everett, Massachusetts, presents a mixed safety profile that warrants careful consideration for potential residents. While the city's violent crime rate of 198.3 incidents per 100,000 residents is notably lower than the national average, its property crime rate of 1,081.3 per 100,000 is significantly elevated, indicating a heightened risk for theft and burglary. The overall safety picture is further complicated by the city's location within the Greater Boston area, where progressive judicial policies in Middlesex County and surrounding jurisdictions have been linked to lower incarceration rates and a greater likelihood of repeat offenses, a factor that directly impacts community security.
Crime in context
When compared to state and national benchmarks, Everett's crime data reveals a stark contrast. The violent crime rate of 198.3 per 100,000 is roughly 43% lower than the national average of approximately 380 per 100,000, placing it in a safer tier for serious offenses like assault and robbery. However, the property crime rate of 1,081.3 per 100,000 is about 30% higher than the national average of roughly 830 per 100,000, and substantially above the Massachusetts state average. This disparity is a key concern, as property crime—including larceny, motor vehicle theft, and burglary—is the type of crime most likely to affect daily life. The elevated property crime rate is consistent with trends seen in dense, transit-connected urban communities near Boston, where opportunistic theft is more common.
What residents experience
For those living in Everett, the day-to-day experience of safety is heavily shaped by property crime. Residents frequently report issues with package theft, car break-ins, and vandalism, particularly in areas with higher foot traffic and multi-family housing. The city's progressive district attorney's office, which has emphasized diversion programs and reduced prosecution for non-violent property offenses, has been criticized by some residents and local officials for creating a permissive environment that encourages repeat offending. While violent confrontations are less common, the perception of safety is eroded by the constant low-level threat of theft. This is a direct consequence of a justice system that often prioritizes rehabilitation over incarceration, leading to more offenders remaining in the community rather than being removed from the streets.
Neighborhood-level variation is significant. The areas closer to the Wellington MBTA station and along Broadway tend to experience higher rates of property crime due to easier access for transient offenders. In contrast, the more residential, single-family home neighborhoods near the Malden border and the Mystic River tend to have lower reported crime rates. However, the overarching influence of the county's progressive judicial philosophy means that even in quieter pockets, residents cannot fully escape the systemic risk posed by a lenient approach to repeat property criminals. For those prioritizing security, understanding this judicial context is as important as the raw crime statistics.
* Values derived from national, state, county, city and local statistics and may differ in a specific area. Last updated: 2026-05-01T04:52:37.000Z
Narrative content on this page is AI-generated and may contain mistakes. Verify any details that matter before acting on them.
ReloMaps may earn a commission from affiliate links at no extra cost to you.