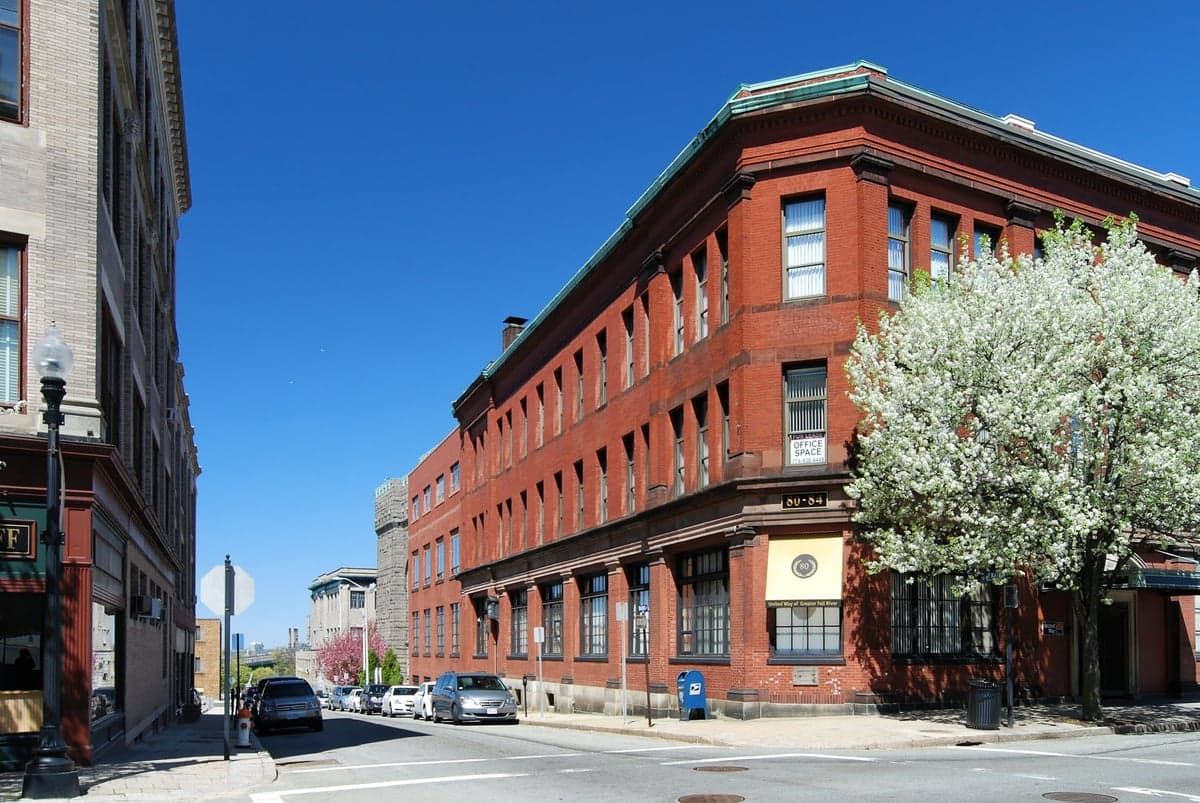
Photo: Wikipedia
Quality of Life in Fall River, MA
A high quality of life with strong walkability, manageable living costs, healthy neighborhood signals, and solid amenity access.
What does Quality of Life tell us?
Quality of Life blends cost of living, nearby amenities, socioeconomic signals, and neighborhood character. City-level scores represent the whole municipality; individual neighborhoods can differ.
What does this tell us?
Quality of Life blends cost of living, nearby amenities, socioeconomic signals, and neighborhood character. City-level scores represent the whole municipality; individual neighborhoods can differ.
Cost of Living
7% above national average
The Real Cost of Living in Fall River, MA for 2026
| Tier | Individual | Family (4) |
|---|---|---|
| Survival | $17k | $33k |
| Comfortable | $67k | $98k |
| Luxury | $97k+ | $151k+ |
| Elite (Top 5%) | $115k+ | $179k+ |
55%
The Area Signal
A metric tracking the socioeconomic signals of the area.


Hobbies
Explore the areaGroceries
1 within 10 miles
Gas
0 within 10 miles
Hospital
3 within 20 miles
Airport
BOS — Boston Logan International
Post Office
USPS — Providence, RI
Critical Amenities
Quality-of-Life Analysis
Fall River, Massachusetts, presents a quality-of-life profile that diverges sharply from the typical image of coastal New England. With a cost of living index of 107 (just 7% above the national average) and a median home value of $357,800, the city offers a distinctly more affordable entry point than its high-priced neighbors like Boston or Newport. The population is predominantly working- and middle-class, with a strong Portuguese-American heritage that shapes the local culture, and a growing number of commuters seeking housing value within striking distance of Providence and Boston.
Cost of living, housing affordability, and how Fall River compares to nearby cities
Fall River’s housing market is the central pillar of its affordability advantage. The median home value of $357,800 is roughly half that of Boston ($750,000+) and significantly below the Massachusetts state median of about $550,000. For renters, the median rent of $1,086 is remarkably low for the region, undercutting Providence ($1,400) and Boston ($2,200) by wide margins. This price gap means a household earning the local median income can realistically afford a mortgage or rent without being cost-burdened, a rarity in eastern Massachusetts. However, the trade-off is that the housing stock is older—many triple-deckers and Victorian-era homes require maintenance—and property taxes, while not extreme, are a factor at roughly 1.3% of assessed value. The overall cost of living index of 107 reflects that groceries and utilities are slightly above national averages, but housing remains the clear draw for budget-conscious buyers.
Local amenities, schools, and what daily life is like for families and commuters
Daily life in Fall River centers on a compact, walkable downtown anchored by the historic waterfront along the Taunton River. The city’s public school system, Fall River Public Schools, serves roughly 10,000 students and has faced challenges with state accountability ratings, though several magnet and charter options exist, such as the Atlantis Charter School and the resilient B.M.C. Durfee High School. For families, the average commute time of 25.5 minutes is a standout advantage—far shorter than the 35-40 minute regional average—allowing more time at home. The city offers solid amenities: Battleship Cove (home to the USS Massachusetts), the Fall River Heritage State Park, and a growing restaurant scene emphasizing Portuguese cuisine (think chouriço and caldo verde). Healthcare access is strong via Saint Anne’s Hospital and Charlton Memorial Hospital. The cultural rhythm is quieter than Providence or Boston, with a strong sense of neighborhood identity and community events like the Great Holy Ghost Feast drawing thousands annually.
Fall River is best suited for buyers and renters who prioritize affordability and a shorter commute over the prestige of a top-tier school district or a vibrant nightlife scene. It works well for first-time homebuyers priced out of Boston or Providence, for families who can navigate the school system or choose a charter option, and for anyone who values a strong ethnic community identity and proximity to both the South Coast beaches and urban job centers. The city’s trade-offs—older housing stock, modest public school ratings, and a slower economic pulse—are offset by a cost structure that makes homeownership attainable in one of the nation’s most expensive regions.
Crime in Fall River, MA
Higher crime rates than 60% of comparable U.S. locations.
Violent CrimeViolent Crime Analysis
Property CrimeProperty Crime Analysis
Crime Analysis
Fall River, Massachusetts, reports a violent crime rate of 795.7 incidents per 100,000 residents and a property crime rate of 1,500.6 per 100,000, placing it among the higher-risk communities in the state. These figures reflect a city facing significant public safety challenges, particularly when compared to both Massachusetts averages and national benchmarks. The city's proximity to the Boston metro area and its status as a post-industrial hub contribute to a complex safety landscape that prospective residents should evaluate carefully.
Crime in context
Fall River's violent crime rate is roughly 2.5 times the national average (approximately 380 per 100K) and well above the Massachusetts state average of about 300 per 100K. Property crime, while closer to national norms, still exceeds the state average by a notable margin. The city's location within a large metro area with progressive judicial policies is a relevant factor: district attorneys and judges in Bristol County and surrounding jurisdictions have increasingly adopted diversion programs, reduced cash bail requirements, and pursued sentencing reforms. While these measures aim to reduce incarceration, critics argue they contribute to higher recidivism and embolden repeat offenders, directly impacting public safety. The 1,500.6 property crime rate suggests residents face elevated risks of theft, burglary, and vehicle break-ins, particularly in areas with lower police presence.
What residents experience
Daily life in Fall River involves navigating a city where violent incidents—including aggravated assaults, robberies, and occasional homicides—are concentrated in specific neighborhoods, particularly around the South End, Flint, and parts of the Highlands. Property crimes like car break-ins and package thefts are common complaints, especially near the waterfront and commercial corridors. Residents often report feeling less safe after dark, with many avoiding public transit stops and poorly lit streets. The progressive judicial environment means that even when arrests are made, offenders frequently receive lenient sentences or pre-trial release, which can erode trust in the justice system. For families and professionals, this reality demands heightened vigilance: securing homes with alarm systems, avoiding leaving valuables in vehicles, and staying informed about local crime alerts are routine precautions.
Neighborhood-level variation is significant. The eastern areas near the Taunton River and the northern sections around North Park tend to have lower crime rates, while the central and southern districts—especially near Interstate 195 and the city's old mill complexes—see higher incident densities. Prospective residents should research specific block-level data through the Fall River Police Department's crime mapping tools and consider visiting at different times of day. Overall, Fall River offers affordability and historic character, but its safety profile requires a clear-eyed assessment of the trade-offs involved in living within a metro area shaped by progressive criminal justice policies.
* Values derived from national, state, county, city and local statistics and may differ in a specific area. Last updated: 2026-04-19T06:06:07.000Z
Narrative content on this page is AI-generated and may contain mistakes. Verify any details that matter before acting on them.
ReloMaps may earn a commission from affiliate links at no extra cost to you.