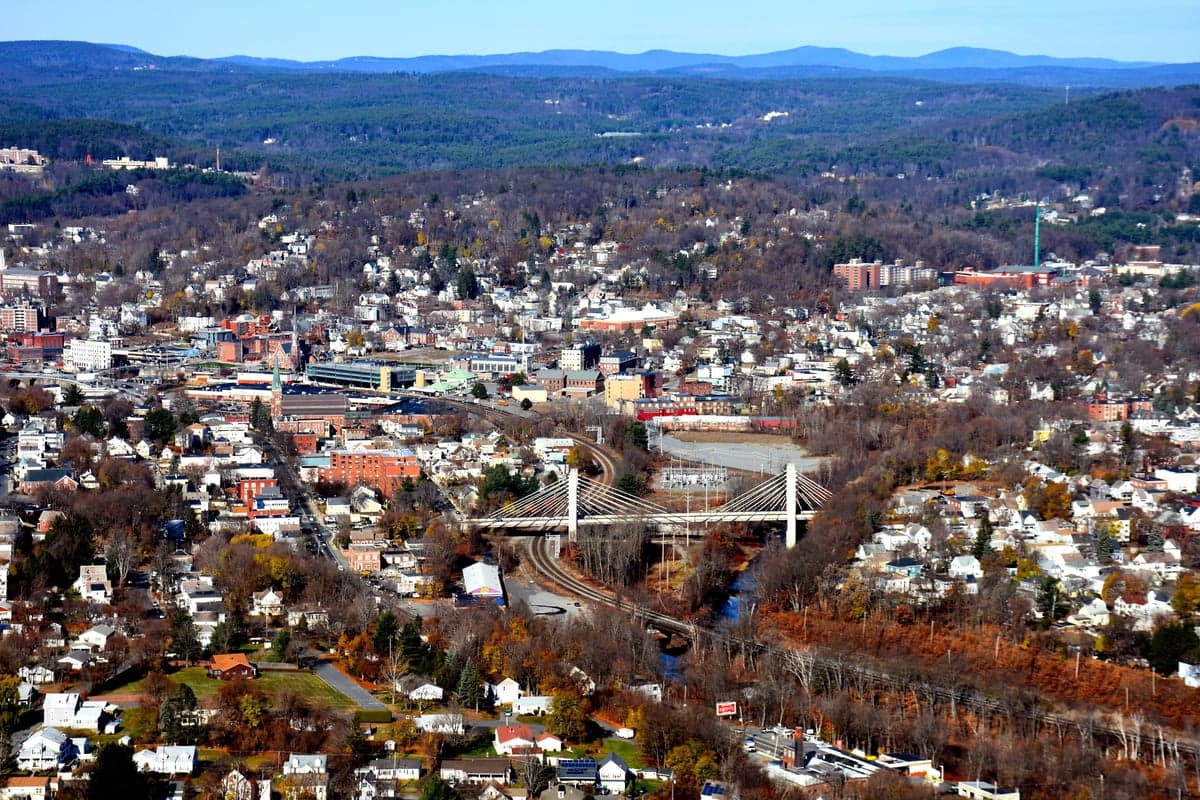
Photo: Wikipedia
Demographics of Fitchburg, MA
Affluence Level in Fitchburg, MA
A middle-class area roughly in line with national averages across income, home values, education, and employment.
People of Fitchburg, MA
The people of Fitchburg, Massachusetts today number 41,633, forming a city that is notably more diverse than its surrounding North Central Massachusetts region. With a population that is 56.9% white, 30.5% Hispanic, 5.7% Black, 1.4% East and Southeast Asian, and 0.6% Indian subcontinent, Fitchburg has a working-class, urban character distinct from the suburban bedroom communities of Worcester County. The city is densely settled along the Nashua River valley, with a foreign-born population of 5.0% and a college-educated rate of 24.5%, reflecting a community shaped by industrial roots and recent demographic change.
How the city was settled and grew
Fitchburg was originally part of the Nashoba Plantation, settled by English colonists in the 1730s and incorporated as a town in 1764. The city’s early population was overwhelmingly Yankee Protestant, drawn by fertile river valley land and water power from the Nashua River. The real population boom came with the Industrial Revolution: by the 1840s, Fitchburg had become a major manufacturing center for paper, machine tools, and textiles. The Upper Common and Lower Common neighborhoods were built by Irish immigrants who arrived in the 1840s and 1850s to dig the Fitchburg Railroad and work in the mills. French-Canadian families followed from Quebec in the 1870s and 1880s, settling heavily in the Cleghorn neighborhood, where they built St. Joseph’s Church and established a distinct Franco-American community. Italian immigrants arrived in the early 1900s, concentrating in the West Fitchburg area near the paper mills. By 1920, Fitchburg’s population had swelled to over 41,000, making it one of the largest cities in Worcester County. Polish and Lithuanian immigrants also arrived in smaller numbers, forming enclaves along the river flats. The city’s industrial peak in the 1950s supported a dense, walkable urban fabric of triple-deckers and mill housing, with distinct ethnic parishes and social clubs anchoring each neighborhood.
Modern era (post-1965)
After the 1965 Hart-Cellar Act, Fitchburg’s demographic trajectory shifted dramatically. The city’s industrial base collapsed in the 1970s and 1980s, with paper mills and machine shops closing, leading to population decline from a peak of 43,000 in 1960 to 39,000 by 1990. White flight to suburban towns like Lunenburg and Leominster accelerated, and the city’s housing stock became affordable for new arrivals. The South Fitchburg neighborhood, once home to French-Canadian mill workers, became the primary landing zone for Puerto Rican migrants starting in the 1970s, drawn by manufacturing jobs and family networks. By 2000, the Hispanic share of the population had risen to 15%, and by 2020 it reached 30.5%. Dominican and Central American immigrants followed in the 1990s and 2000s, settling alongside Puerto Ricans in South Fitchburg and the Rollstone Hill area. The Black population, now 5.7%, includes both African American families who moved from Boston and Springfield and a smaller number of African immigrants, concentrated near the Fitchburg State University campus. East and Southeast Asian residents (1.4%) are primarily Vietnamese and Cambodian families, with a small cluster near the Main Street corridor. The Indian subcontinent population (0.6%) is newer, largely professionals and students connected to the university and regional hospitals, living in the Westminster Hill area. The city’s foreign-born share of 5.0% is lower than the state average of 17%, reflecting that most Hispanic growth has come from U.S.-born Puerto Ricans and second-generation families.
The future
Fitchburg’s population is trending toward a majority-minority status, likely within the next 10-15 years. The white population, which was 80% as recently as 2000, is declining through out-migration and an aging demographic, while the Hispanic share continues to grow through both migration and higher birth rates. The city is not homogenizing; instead, it is tribalizing into distinct enclaves. South Fitchburg and Rollstone Hill are becoming overwhelmingly Hispanic, while the Upper Common and Cleghorn neighborhoods retain older white ethnic populations, many of them elderly. The Black and Asian populations are small and stable, with no major influx expected. The Indian subcontinent community is likely to grow modestly as Fitchburg State University expands its international enrollment. The city’s college-educated rate of 24.5% is below the state average of 44%, and without a major economic catalyst, the population is unlikely to see rapid growth. The next 10-20 years will likely see Fitchburg become a majority-Hispanic, working-class city with a shrinking white minority and a small but stable multi-ethnic presence.
For someone moving in now, Fitchburg is a city in demographic transition: affordable, urban, and increasingly Hispanic, with a strong sense of neighborhood identity but limited economic opportunity. The city offers lower housing costs than most of Massachusetts, but the school system and public services face challenges from a declining tax base. New residents should expect a community that is more diverse and more working-class than its suburban neighbors, with a future shaped by whether the city can attract investment to match its demographic change.
* Values derived from national, state, county, city and local statistics and may differ in a specific area. Last updated: 2026-05-01T11:11:37.000Z
Narrative content on this page is AI-generated and may contain mistakes. Verify any details that matter before acting on them.
ReloMaps may earn a commission from affiliate links at no extra cost to you.