
Photo: Wikipedia
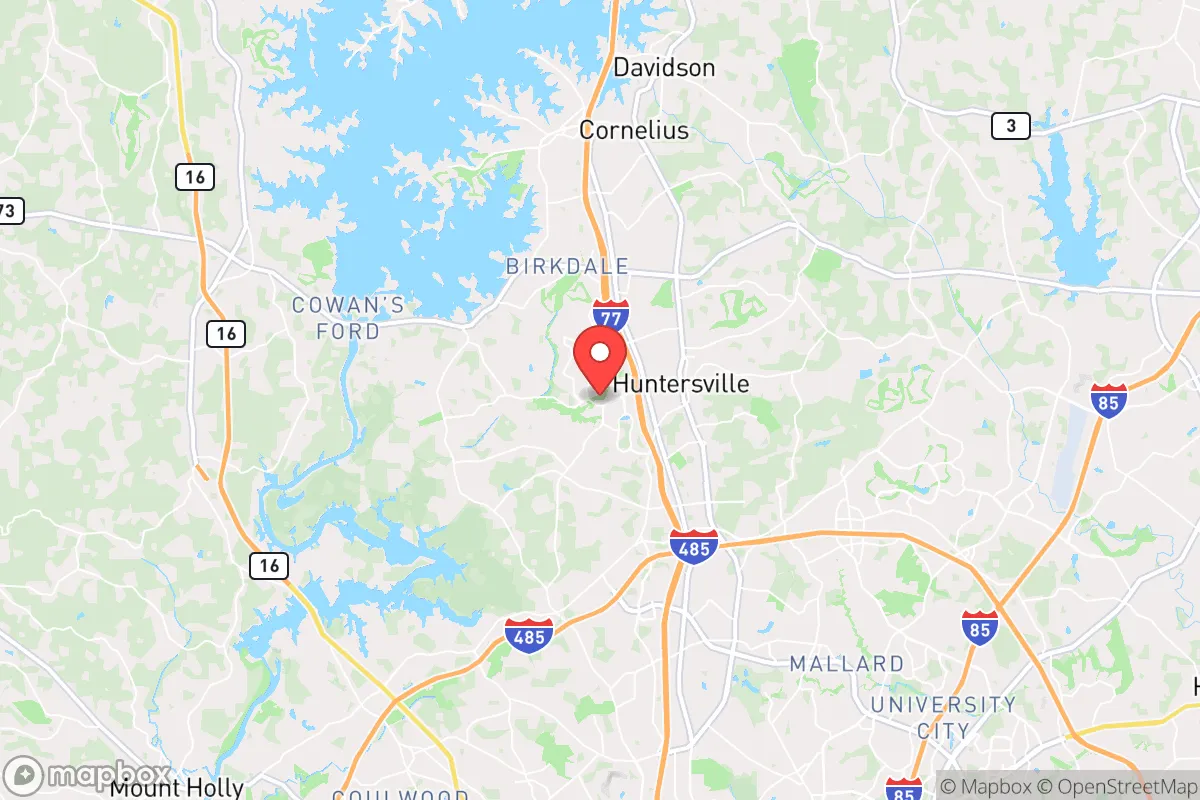
Quality of Life in Huntersville, NC
A high quality of life with strong walkability, manageable living costs, healthy neighborhood signals, and solid amenity access.
What does Quality of Life tell us?
Quality of Life blends cost of living, nearby amenities, socioeconomic signals, and neighborhood character. City-level scores represent the whole municipality; individual neighborhoods can differ.
What does this tell us?
Quality of Life blends cost of living, nearby amenities, socioeconomic signals, and neighborhood character. City-level scores represent the whole municipality; individual neighborhoods can differ.
Cost of Living
52% above national average
The Real Cost of Living in Huntersville, NC for 2026
| Tier | Individual | Family (4) |
|---|---|---|
| Survival | $28k | $52k |
| Comfortable | $85k | $125k |
| Luxury | $193k+ | $299k+ |
| Elite (Top 5%) | $227k+ | $352k+ |
96%
The Area Signal
A metric tracking the socioeconomic signals of the area.
Hobbies
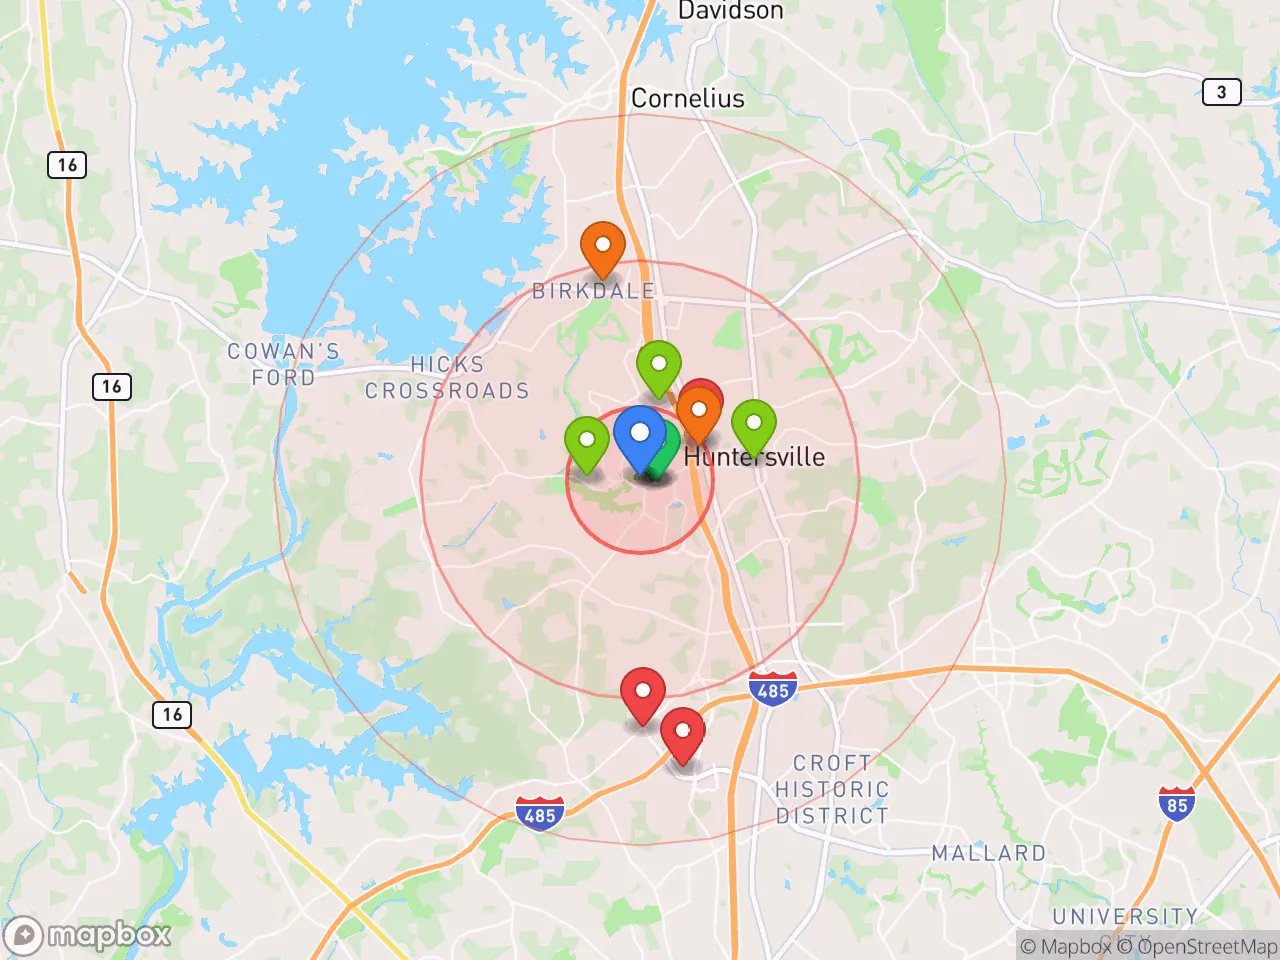
Explore the areaGroceries
7 within 10 miles
Gas
20 within 10 miles
Hospital
20 within 20 miles
Airport
CLT — Charlotte Douglas International
Post Office
USPS — Huntersville, NC
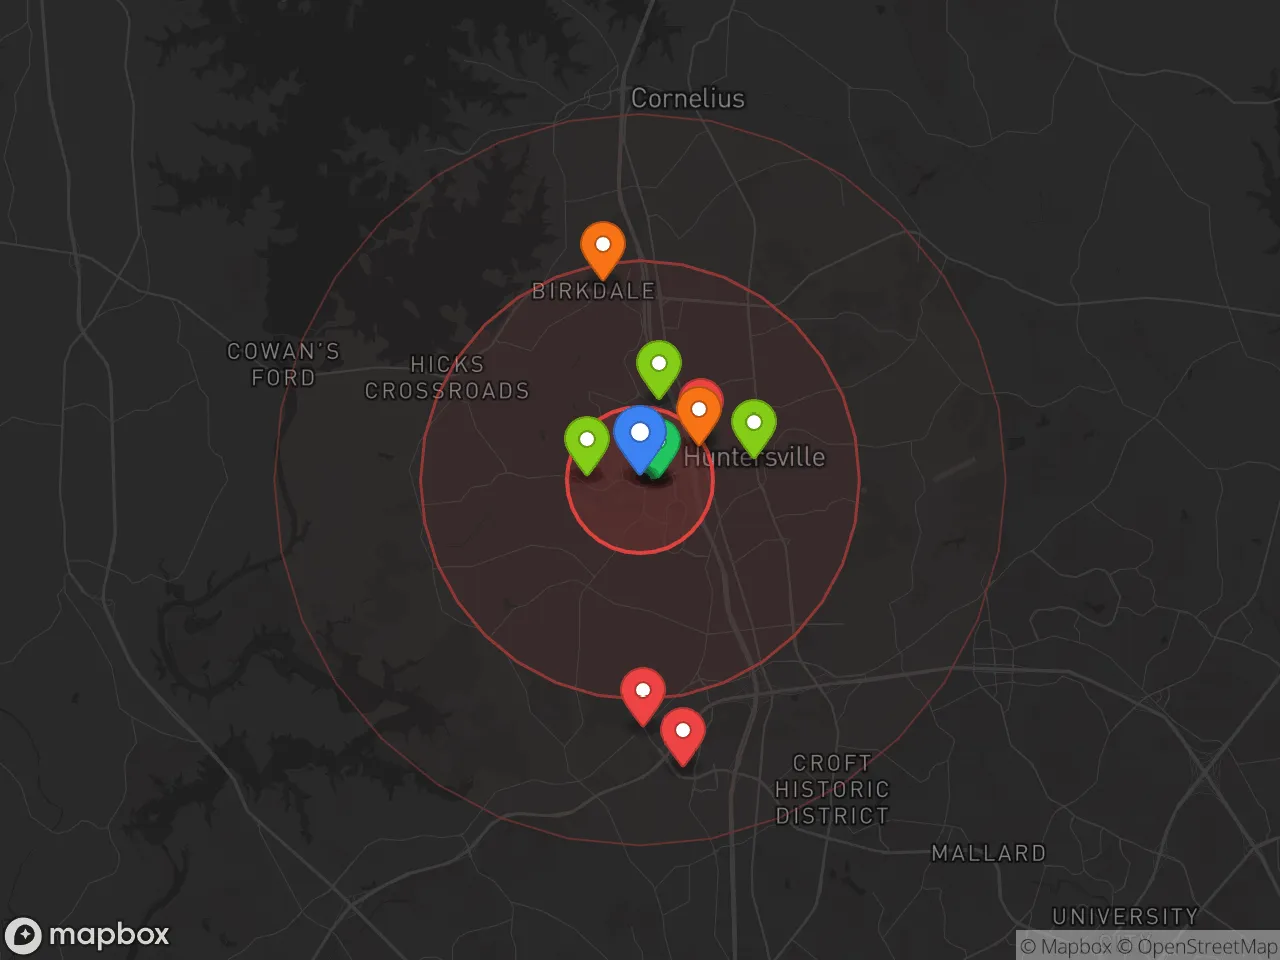
Critical Amenities
Quality-of-Life Analysis
Huntersville, North Carolina, presents a distinctly affluent quality of life, attracting a demographic of upper-middle-class professionals, corporate transferees, and families seeking top-tier schools and suburban space within commuting distance of Charlotte. With a cost of living index of 152 (52% above the U.S. average), the town is notably more expensive than nearby Lake Wylie or Denver, but often considered a value proposition compared to Charlotte’s most exclusive neighborhoods like Myers Park or Dilworth. The population skews toward married couples with children, and the local economy is heavily anchored by finance, energy, and healthcare sectors, with many residents employed by Bank of America, Duke Energy, or Atrium Health.
Cost of living, housing prices, and affordability compared to Charlotte and Lake Norman
Huntersville’s housing market is the primary driver of its elevated cost of living. The median home value sits at $439,300, roughly 40% higher than the national median and significantly above the Charlotte metro average of approximately $375,000. For renters, the median monthly rent of $1,742 places Huntersville among the priciest rental markets in the Lake Norman region, outpacing Cornelius and Mooresville by $100–$200 per month. While these figures are steep, they remain below Charlotte’s most expensive intown neighborhoods, where single-family homes routinely exceed $700,000. The trade-off is space: Huntersville homes average 2,200–2,800 square feet with yards, compared to smaller lots inside the city. Property taxes in Mecklenburg County are moderate at roughly 0.85% of assessed value, but the lack of a state income tax on retirement income is a minor offset for older buyers. For a family earning $120,000–$150,000 annually, housing is manageable; for those earning under $80,000, it is a significant stretch.
What daily life is like for families: schools, parks, and commute realities
Daily life in Huntersville revolves around its highly rated public schools, extensive greenway system, and a car-dependent commute pattern. The town is served by Charlotte-Mecklenburg Schools (CMS), with Hough High School and Bailey Middle School consistently earning A ratings from Niche and GreatSchools, making them a primary draw for relocating families. For recreation, the Robbins Park and Jetton Park (on Lake Norman) offer sports fields, walking trails, and lake access, while the Carolina Thread Trail provides miles of paved paths for biking and running. The average commute time of 27.2 minutes is slightly above the national average, driven by the 15–20 mile drive to Uptown Charlotte via I-77. This corridor is notorious for congestion, though the I-77 Express Lanes (toll lanes) offer a faster but costly alternative for commuters willing to pay $4–$8 per trip. Dining and shopping are concentrated along Birkdale Village, an outdoor lifestyle center with national retailers and local restaurants, and the newer Northlake Mall area. Nightlife is limited to a handful of breweries and sports bars; residents seeking a vibrant bar scene typically drive to Charlotte’s NoDa or SouthEnd districts.
Huntersville is best suited for families and professionals who prioritize excellent public schools, low crime rates, and suburban amenities over urban walkability or nightlife. The town works well for dual-income households with at least one remote or hybrid worker, as the commute to Charlotte can be draining for a daily five-day office schedule. Empty nesters downsizing from larger homes in the region also find appeal in the newer patio-home developments near the lake. However, singles and young renters on a budget may find the cost-to-amenity ratio unfavorable compared to Charlotte’s more affordable and lively neighborhoods. For those who fit the demographic—upper-middle-class families with school-age children—Huntersville offers a stable, well-resourced environment with strong property value appreciation and a tight-knit community feel.
Crime in Huntersville, NC
Generally safer than 70% of comparable U.S. locations.
Violent CrimeViolent Crime Analysis
Property CrimeProperty Crime Analysis
Crime Analysis
Huntersville, North Carolina, presents a mixed safety profile for potential residents. The town’s violent crime rate of 115.3 incidents per 100,000 people is notably lower than both the national and state averages, but its property crime rate of 1,100.2 per 100,000 exceeds the national median, signaling that theft and burglary are more pressing concerns. As a rapidly growing suburb of Charlotte, Huntersville benefits from the economic opportunities of a major metro area but also inherits the broader regional challenges of a justice system that, in many parts of Mecklenburg County, has adopted progressive policies that critics argue prioritize offender rehabilitation over public safety.
Crime in context
When compared to national benchmarks, Huntersville’s violent crime rate is roughly 60% lower than the U.S. average of about 380 per 100,000, and well below North Carolina’s state rate of approximately 350 per 100,000. This places the town among the safer communities in the Charlotte region for violent offenses like homicide, assault, and robbery. However, the property crime rate of 1,100.2 per 100,000 is about 15% higher than the national average of roughly 1,950 per 100,000, though it remains lower than Charlotte’s own rate. The disparity reflects a common pattern in affluent suburbs: lower violent crime but elevated property crime driven by vehicle break-ins, package theft, and residential burglaries.
What residents experience
Daily life in Huntersville for most residents involves a low risk of violent victimization, but property crime is a tangible annoyance. The town’s police department reports that larceny from motor vehicles and unsecured garages accounts for a significant share of incidents, particularly in neighborhoods near major retail corridors like Birkdale Village and the I-77 interchange. Residents should note that while the town itself has not adopted the most aggressive progressive prosecutorial policies seen in Charlotte proper, the Mecklenburg County District Attorney’s office—which handles all felony cases from Huntersville—has implemented diversion programs and reduced cash bail for non-violent offenders. Critics argue these policies contribute to a revolving-door effect for property criminals, undermining deterrence and increasing the likelihood of repeat offenses in suburban areas.
Neighborhood-level variation is significant. Established, higher-priced communities like The Vineyards and the areas around Lake Norman typically report the lowest crime rates, while more transient rental-heavy zones near the I-77 exits and apartment complexes near the Huntersville-Concord border see elevated property crime. The town’s overall safety is best described as strong for violent crime but requiring vigilance against property theft, with the broader regional justice system’s progressive lean adding a layer of concern for long-term public safety outcomes.
* Values derived from national, state, county, city and local statistics and may differ in a specific area. Last updated: 2026-04-24T14:55:51.000Z
Narrative content on this page is AI-generated and may contain mistakes. Verify any details that matter before acting on them.
ReloMaps may earn a commission from affiliate links at no extra cost to you.