
Photo: Wikipedia
Quality of Life in Jersey City, NJ
Above-average quality of iife. The area offers a reasonable cost of living, decent mobility, and a mix of neighborhood amenities.
What does Quality of Life tell us?
Quality of Life blends cost of living, nearby amenities, socioeconomic signals, and neighborhood character. City-level scores represent the whole municipality; individual neighborhoods can differ.
What does this tell us?
Quality of Life blends cost of living, nearby amenities, socioeconomic signals, and neighborhood character. City-level scores represent the whole municipality; individual neighborhoods can differ.
Cost of Living
74% above national average
The Real Cost of Living in Jersey City, NJ for 2026
| Tier | Individual | Family (4) |
|---|---|---|
| Survival | $30k | $57k |
| Comfortable | $104k | $153k |
| Luxury | $171k+ | $265k+ |
| Elite (Top 5%) | $233k+ | $361k+ |
62%
The Area Signal
A metric tracking the socioeconomic signals of the area.
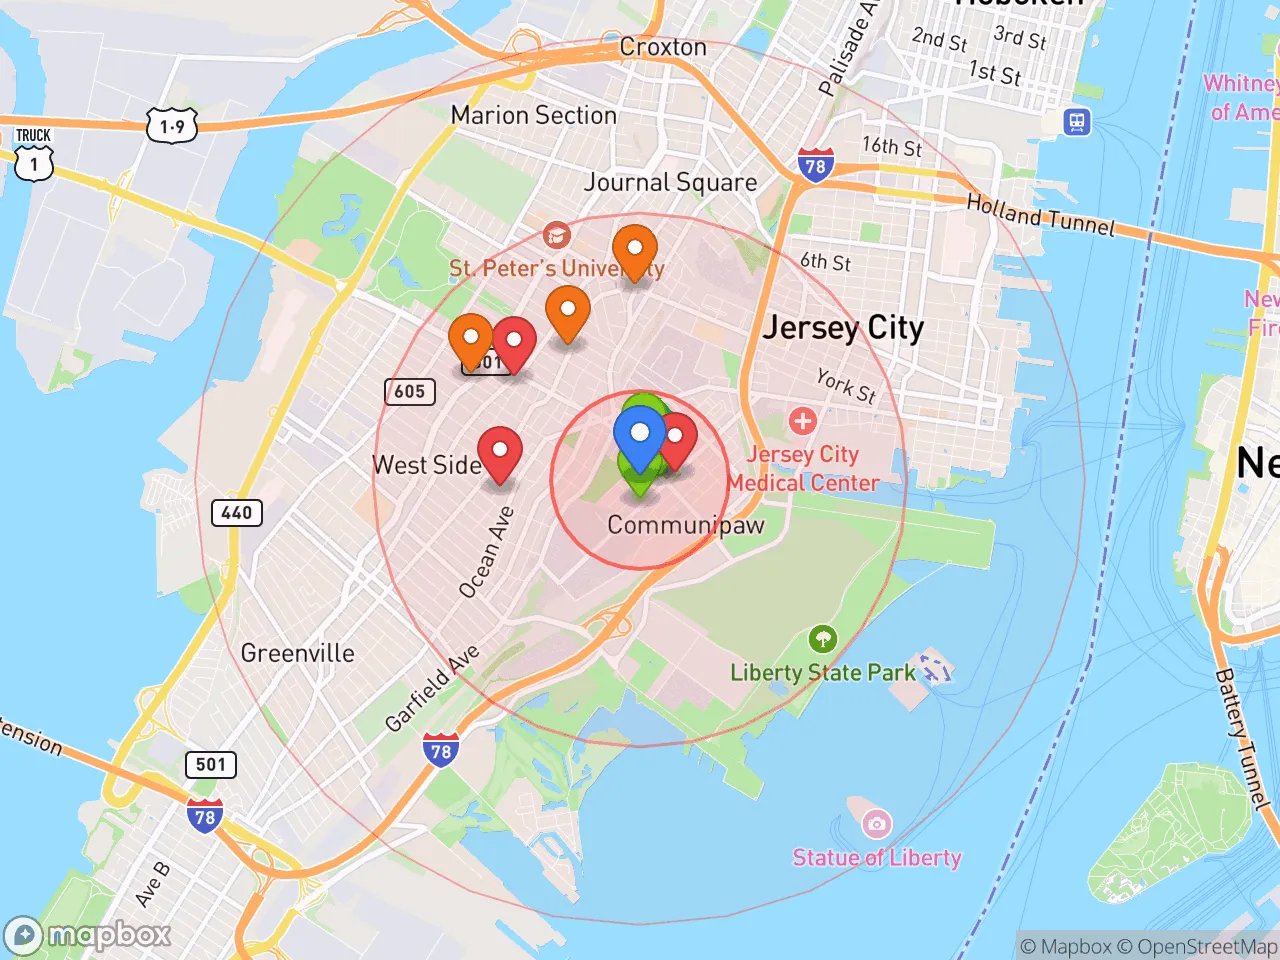
Hobbies
Explore the areaGroceries
7 within 10 miles
Gas
20 within 10 miles
Hospital
20 within 20 miles
Airport
EWR — Newark Liberty International
Post Office
USPS — Jersey City, NJ
Critical Amenities
Quality-of-Life Analysis
Jersey City presents a high-cost, high-reward quality of life shaped by its role as a dense, transit-rich alternative to Manhattan. With a cost of living index of 174 (74% above the national average), the city attracts a mix of young professionals, finance and tech workers, and families seeking shorter commutes and more space than New York City offers, while still maintaining an urban, walkable lifestyle. The population skews educated and affluent, though significant income diversity persists across neighborhoods like the Heights, Downtown, and Greenville.
Cost of living, housing costs, and affordability compared to New York City
Jersey City’s cost of living is steep by national standards but remains a relative bargain compared to Manhattan, where comparable rents and home prices can be 40–60% higher. The median home value sits at $534,500, which is roughly half the median in Manhattan but still well above the national median of around $350,000. Median rent is $1,902, a figure that undercuts Manhattan’s median rent of roughly $4,000 but is higher than many New Jersey suburbs like Newark ($1,200) or Bayonne ($1,500). The average one-bedroom in Downtown Jersey City now rents for $2,400–$2,800, while units in the Heights or Journal Square can be found for $1,600–$2,000. Property taxes in Hudson County are among New Jersey’s highest, averaging about 2.1% of assessed value, which adds roughly $11,000 annually to the cost of owning a median-priced home. For renters, the city’s rent-control ordinance (covering buildings built before 1986) provides some stability, but newer luxury towers are exempt, driving up market-rate costs.
Daily life, amenities, schools, and commute realities
Daily life in Jersey City is defined by its walkable neighborhoods, extensive park system (including Liberty State Park and the 1.2-mile Hudson River Waterfront Walkway), and a dining scene that rivals Hoboken’s. The city’s public schools, part of the Jersey City Public Schools district, serve roughly 30,000 students and have shown mixed performance: Dr. Ronald E. McNair Academic High School is consistently ranked among the top 100 high schools nationally, while many elementary and middle schools score below state averages. Private and charter options, such as the Hudson School and BelovED Community Charter School, are popular among families. The average commute time is 36.9 minutes, driven largely by PATH train access to the World Trade Center (22 minutes) and 33rd Street (30 minutes). NJ Transit buses and the Hudson-Bergen Light Rail supplement the PATH, making car ownership optional for many residents. Groceries, dining, and entertainment costs align with the high COL: a dinner out averages $25–$40 per entrée, and a monthly transit pass runs $110 (PATH) plus $90 (NJ Transit bus).
Jersey City is best suited for professionals and families who prioritize proximity to Manhattan, urban amenities, and walkability over suburban space or low costs. The city works well for those earning above the median household income of roughly $82,000, as housing and daily expenses demand a significant share of income. Commuters who can tolerate a 35–40 minute train ride and value a dense, diverse, and politically progressive environment will find the trade-offs worthwhile. Those seeking lower taxes, larger homes, or quieter streets may prefer suburbs like Montclair or Maplewood, but for urbanists who want a shorter commute than most of Brooklyn or Queens, Jersey City remains a top-tier choice.
Crime in Jersey City, NJ
WARNING: The crime statistics are unreliable for this jurisdiction. Local authorities have either not reported or under reported their data to the FBI. This could be due to bad intentions, incompetence or technical issues. Regardless, we suggest skepticism.
Higher crime rates than 74% of comparable U.S. locations.
Violent CrimeViolent Crime Analysis
Property CrimeProperty Crime Analysis
Crime Analysis
Jersey City presents a mixed safety picture for prospective residents. While the city has seen significant redevelopment and population growth, its crime rates remain elevated compared to national averages, a pattern common in dense, large metro areas. The city's violent crime rate of 486.2 per 100,000 residents and property crime rate of 1,829.7 per 100,000 are both substantially higher than the national median, reflecting challenges that are often exacerbated by local criminal justice policies.
Crime in context
Jersey City's violent crime rate is roughly 1.3 times the national average, while its property crime rate is about 1.2 times higher. These figures place it in a similar tier to other Hudson County municipalities but well above suburban communities in western New Jersey. A key factor driving these numbers is the progressive orientation of the local justice system. Hudson County has elected prosecutors and judges who have championed bail reform, diversion programs, and reduced sentencing for nonviolent offenses. While these policies aim to reduce incarceration, critics argue they directly contribute to higher recidivism and embolden property criminals, as repeat offenders face minimal consequences. This ideological approach, common in liberal urban centers, means that criminals are more likely to remain on the street, undermining public safety and victim justice.
What residents experience
For daily life, the most tangible impact is property crime. Vehicle break-ins, package theft, and bicycle theft are routine occurrences, especially in transit-adjacent neighborhoods like Journal Square and the Heights. Residents report that police response times can be slow for non-emergency property crimes, a direct consequence of under-resourced departments dealing with a revolving-door justice system. Violent crime, while less frequent, is concentrated in specific areas: the Greenville and Bergen-Lafayette sections see the majority of shootings and aggravated assaults, often tied to gang activity. Downtown and the Waterfront, by contrast, experience far lower violent crime rates, though property crime remains a persistent annoyance. The disparity is stark: a resident in a downtown high-rise may feel safe walking at night, while someone in a South Side neighborhood faces a very different reality.
Neighborhood-level variation is extreme. Downtown Jersey City, including the Newport and Paulus Hook areas, has a violent crime rate roughly 60% lower than the citywide average, making it comparable to safer suburbs. In contrast, the Greenville and Bergen-Lafayette neighborhoods see rates 2-3 times higher. Property crime, however, is more evenly distributed, with even affluent areas like Hamilton Park reporting frequent car burglaries. For anyone considering a move, the choice of neighborhood is the single most important safety decision. The city's progressive governance means that systemic changes to reduce crime are unlikely in the near term, placing the burden on individual residents to research block-level conditions and invest in security measures.
* Values derived from national, state, county, city and local statistics and may differ in a specific area. Last updated: 2026-04-25T03:04:57.000Z
Narrative content on this page is AI-generated and may contain mistakes. Verify any details that matter before acting on them.
ReloMaps may earn a commission from affiliate links at no extra cost to you.