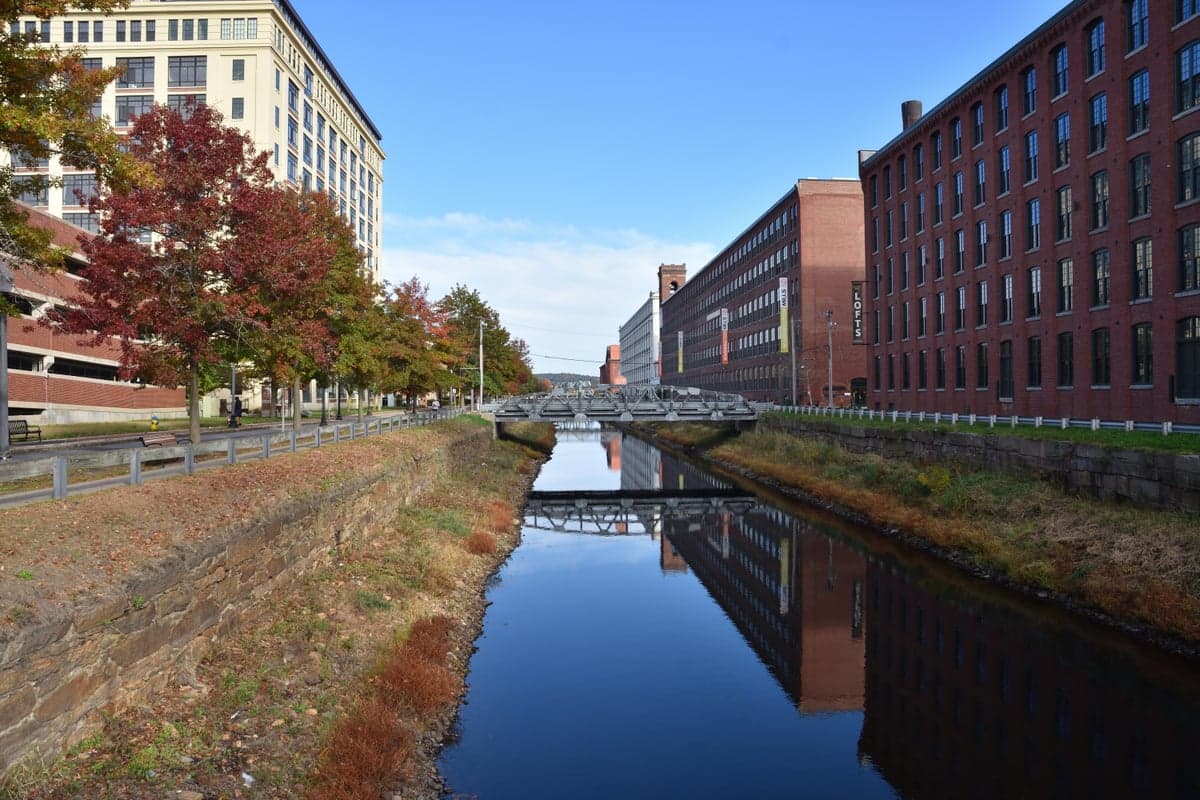
Photo: Wikipedia
Quality of Life in Lawrence, MA
A high quality of life with strong walkability, manageable living costs, healthy neighborhood signals, and solid amenity access.
What does Quality of Life tell us?
Quality of Life blends cost of living, nearby amenities, socioeconomic signals, and neighborhood character. City-level scores represent the whole municipality; individual neighborhoods can differ.
What does this tell us?
Quality of Life blends cost of living, nearby amenities, socioeconomic signals, and neighborhood character. City-level scores represent the whole municipality; individual neighborhoods can differ.
Cost of Living
37% above national average
The Real Cost of Living in Lawrence, MA for 2026
| Tier | Individual | Family (4) |
|---|---|---|
| Survival | $25k | $47k |
| Comfortable | $72k | $107k |
| Luxury | $105k+ | $162k+ |
| Elite (Top 5%) | $125k+ | $194k+ |
54%
The Area Signal
A metric tracking the socioeconomic signals of the area.


Hobbies
Explore the areaGroceries
1 within 10 miles
Gas
0 within 10 miles
Hospital
3 within 20 miles
Airport
BOS — Boston Logan International
Post Office
USPS — Malden, MA
Critical Amenities
Quality-of-Life Analysis
Lawrence, Massachusetts, presents a quality-of-life profile shaped by its status as a more affordable alternative to the high-cost Boston metro area, with a cost-of-living index of 137 (37% above the U.S. average) that still undercuts nearby cities like Cambridge and Newton by a significant margin. The city's population is predominantly working-class and Hispanic (over 80% of residents), creating a vibrant, family-oriented community where Spanish is widely spoken and cultural traditions are deeply woven into daily life. Median home values sit at $393,500 and median rent at $1,569, figures that are roughly half of what one would pay in Boston proper, making Lawrence a practical choice for those seeking urban access without the premium price tag.
How housing costs and affordability compare to Boston and nearby suburbs
Lawrence’s housing market is a key draw for budget-conscious buyers and renters. The median home value of $393,500 is dramatically lower than the Boston metro median of roughly $700,000, and even undercuts nearby Andover ($650,000) and Methuen ($450,000). Median rent of $1,569 is about 30% less than the regional average, though it has risen 8% since 2020 as demand from commuters grows. The average commute time of 23.3 minutes is notably shorter than the Boston metro average of 32 minutes, thanks to Lawrence’s position along I-495 and the Merrimack River corridor. However, property taxes in Essex County average 1.2% of assessed value, slightly above the state median, which can offset some savings for homeowners. For renters, the city’s older housing stock—much of it pre-1940 triple-deckers—keeps prices lower but may require more maintenance or energy costs.
What daily life is like for families: schools, parks, and local amenities
Daily life in Lawrence centers on its walkable neighborhoods, with the downtown area around Essex Street offering a mix of Latin American bakeries, bodegas, and family-run restaurants. The city’s school system, Lawrence Public Schools, serves over 13,000 students and has seen improvement under state receivership since 2012, though proficiency rates in math and English remain below state averages—about 30% versus 52% statewide. For recreation, the Merrimack River provides a natural focal point, with the Lawrence Heritage State Park offering riverfront trails and historical exhibits. The city lacks the high-end retail and dining found in nearby Andover or North Andover, but residents rely on the Lawrence Public Library (a Carnegie library) and community centers like the Campagnone Common for events. Healthcare access is solid, with Lawrence General Hospital providing emergency and primary care, though specialist visits often require a short drive to Methuen or Haverhill.
Who thrives in Lawrence: commuters, families, and cultural communities
Lawrence is best suited for commuters working in the Merrimack Valley or northern Boston suburbs who want a shorter drive and lower housing costs than the urban core offers. Families with school-age children may find the district’s ongoing reforms appealing if they are willing to engage actively with the school system, while those seeking top-tier academics often look to nearby private or charter options. The city’s strong Hispanic community makes it a natural fit for Spanish-speaking residents or those who value a multicultural, tight-knit environment. Young professionals and artists are increasingly drawn to Lawrence’s affordable loft spaces and emerging creative scene along the river, though nightlife and entertainment options remain limited compared to Boston. Retirees on fixed incomes may appreciate the lower rent but should weigh the higher property taxes and older housing stock against their needs. Overall, Lawrence offers a genuine, no-frills quality of life where affordability and community connection outweigh luxury amenities.
Crime in Lawrence, MA
Generally safer than 60% of comparable U.S. locations.
Violent CrimeViolent Crime Analysis
Property CrimeProperty Crime Analysis
Crime Analysis
Lawrence, Massachusetts, reports a violent crime rate of 361 incidents per 100,000 residents and a property crime rate of 899.1 per 100,000, placing it above both the state and national averages for public safety risk. These figures reflect a city grappling with the challenges common to older industrial hubs in the Northeast, where socioeconomic pressures and a strained criminal justice system contribute to elevated crime levels. For anyone considering relocation, understanding the local safety landscape requires a close look at how these rates compare and what they mean for daily life.
Crime in context
Lawrence’s violent crime rate is roughly double the national average of approximately 380 per 100,000, while its property crime rate sits about 20% above the U.S. median. Compared to Massachusetts as a whole—which enjoys some of the lowest crime rates in the country—Lawrence stands out as a significant outlier. The city’s proximity to Boston and its status as a gateway community for new immigrants create a dense, economically diverse environment where property crimes like larceny and motor vehicle theft are persistent concerns. The presence of progressive district attorneys and judges in Essex County, who often prioritize diversion programs and reduced sentencing, is a factor that many residents and analysts cite as contributing to a revolving-door justice system that can undermine deterrence and public confidence.
What residents experience
For those living in Lawrence, the impact of these crime rates is tangible. Violent offenses, while less frequent than property crimes, include aggravated assault and robbery, with incidents concentrated in specific corridors and during late-night hours. Property crime is the more pervasive daily concern: residents report frequent package thefts, vehicle break-ins, and vandalism, particularly in densely populated neighborhoods near the Merrimack River. The city’s liberal-leaning judicial philosophy, which emphasizes rehabilitation over incarceration, has led to criticism that repeat offenders cycle through the system without meaningful consequences, leaving victims feeling underserved. This dynamic can erode trust in law enforcement and create an atmosphere where residents feel they must take extra precautions, such as installing security cameras and avoiding certain streets after dark.
Neighborhood-level variation
Safety in Lawrence is not uniform. The South Common and Tower Hill areas tend to see higher concentrations of reported incidents, while neighborhoods like the Upper High Service Area and parts of the Arlington district are comparatively quieter, with lower crime densities. Property crime rates can vary by as much as 40% between census tracts, meaning that a move of just a few blocks can significantly change one’s risk profile. Prospective residents should examine block-level crime maps and consider visiting at different times of day to gauge local conditions. Ultimately, Lawrence offers affordability and cultural richness, but the city’s elevated crime rates and the effects of progressive criminal justice policies are critical factors that demand careful consideration before making a move.
* Values derived from national, state, county, city and local statistics and may differ in a specific area. Last updated: 2026-04-19T08:07:48.000Z
Narrative content on this page is AI-generated and may contain mistakes. Verify any details that matter before acting on them.
ReloMaps may earn a commission from affiliate links at no extra cost to you.