
Photo: Wikipedia
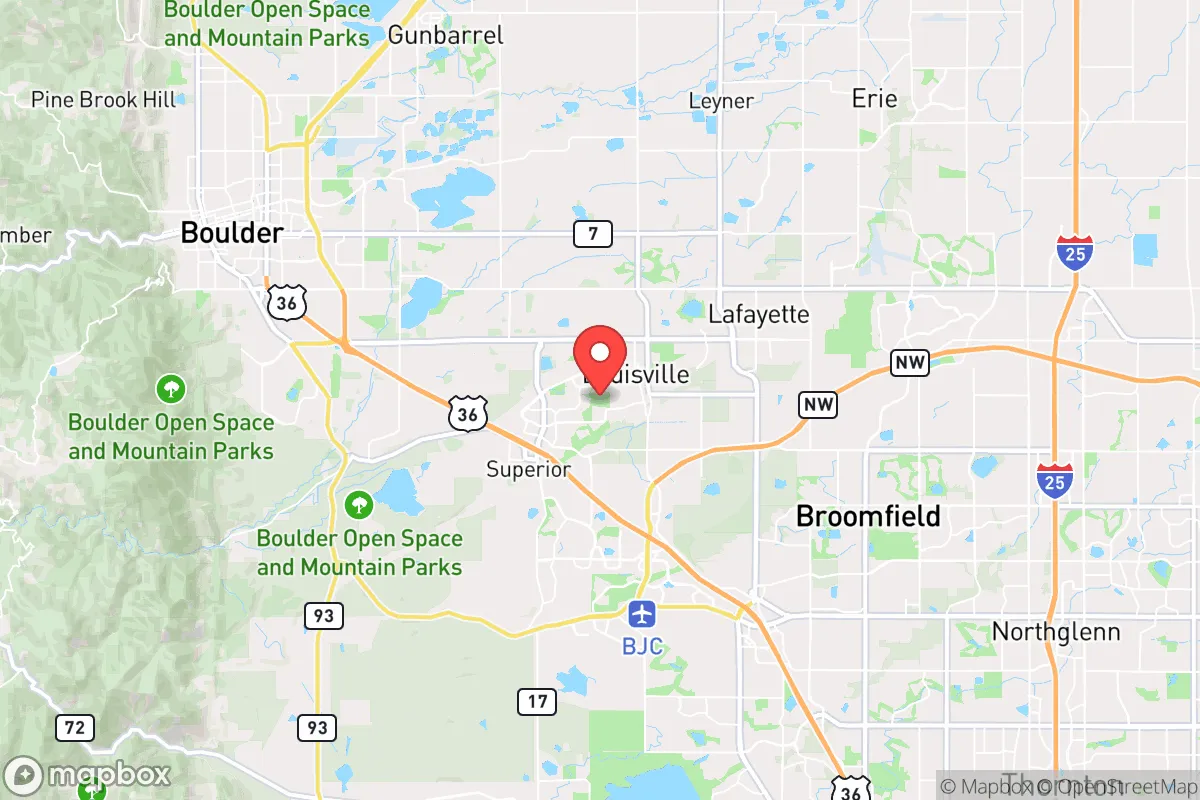
Quality of Life in Louisville, CO
A high quality of life with strong walkability, manageable living costs, healthy neighborhood signals, and solid amenity access.
What does Quality of Life tell us?
Quality of Life blends cost of living, nearby amenities, socioeconomic signals, and neighborhood character. City-level scores represent the whole municipality; individual neighborhoods can differ.
What does this tell us?
Quality of Life blends cost of living, nearby amenities, socioeconomic signals, and neighborhood character. City-level scores represent the whole municipality; individual neighborhoods can differ.
Cost of Living
125% above national average
The Real Cost of Living in Louisville, CO for 2026
| Tier | Individual | Family (4) |
|---|---|---|
| Survival | $33k | $62k |
| Comfortable | $152k | $223k |
| Luxury | $222k+ | $345k+ |
| Elite (Top 5%) | $262k+ | $406k+ |
67%
The Area Signal
A metric tracking the socioeconomic signals of the area.
Hobbies
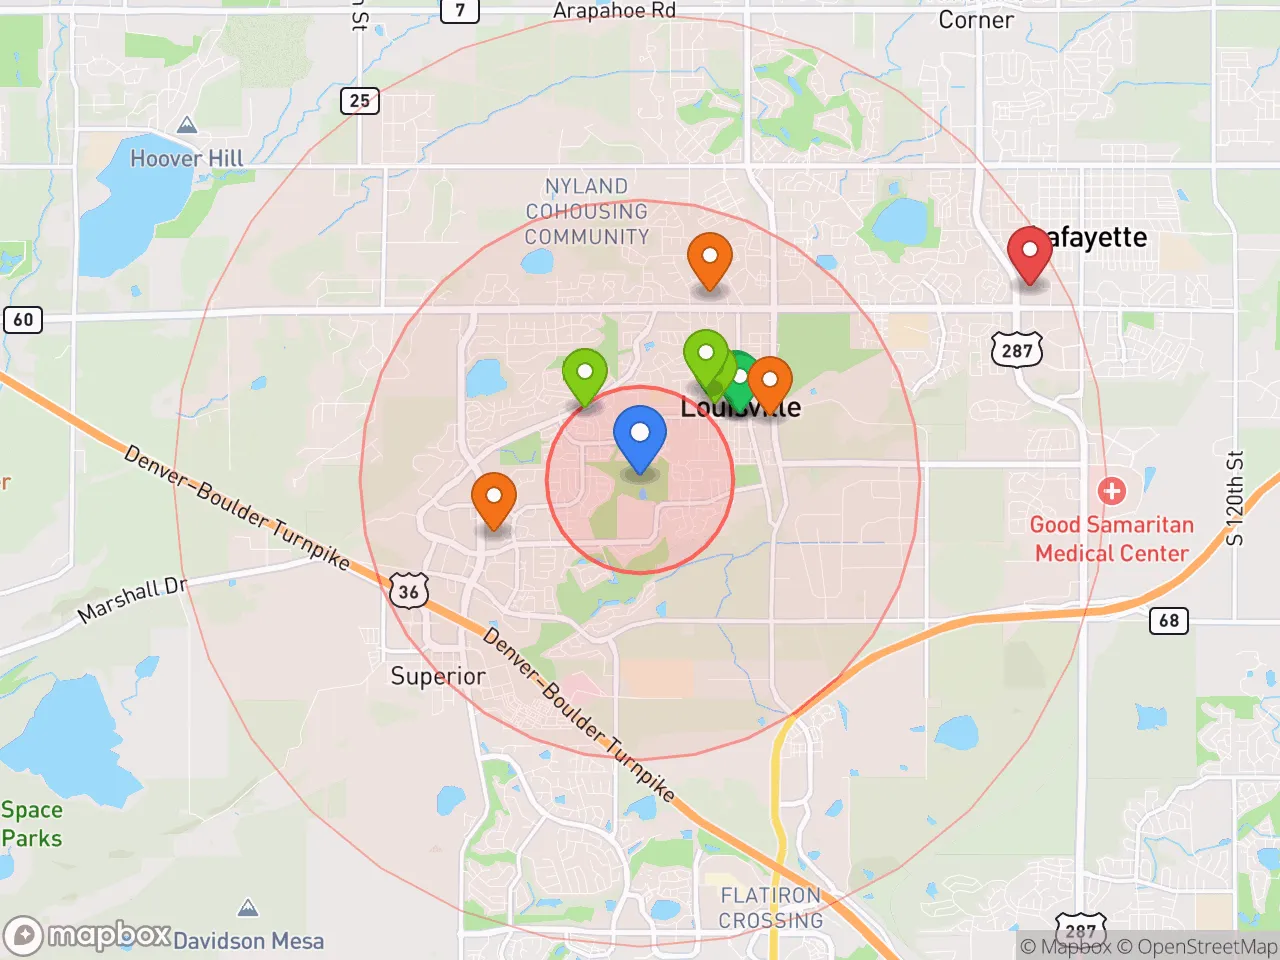
Explore the areaGroceries
7 within 10 miles
Gas
20 within 10 miles
Hospital
20 within 20 miles
Airport
DEN — Denver International
Post Office
USPS — Louisville, CO
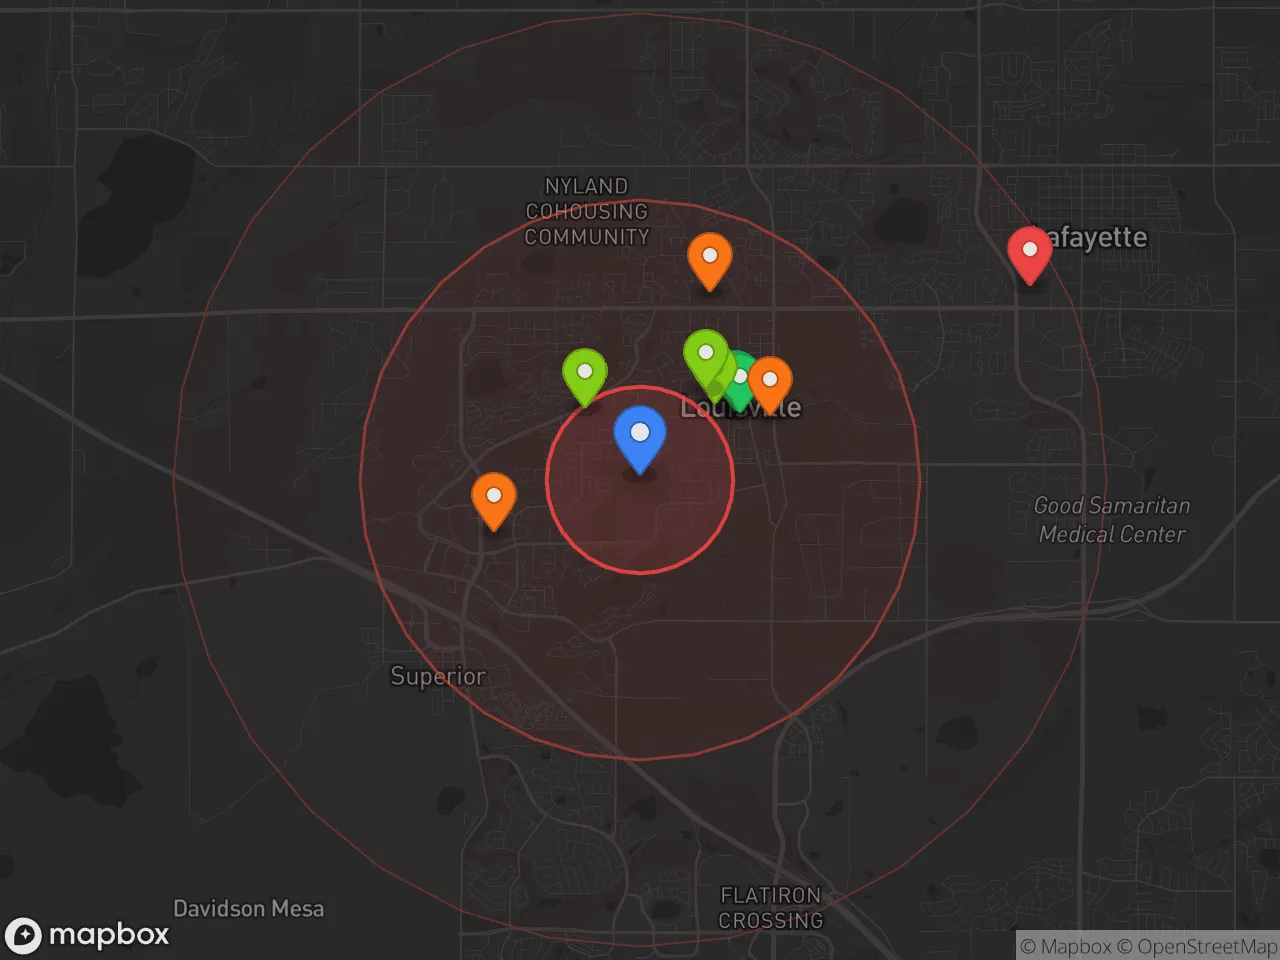
Critical Amenities
Quality-of-Life Analysis
Louisville, Colorado, is an affluent Boulder County suburb where the cost of living index sits at 225—more than double the national average—reflecting a community of well-educated professionals, remote workers, and families drawn to its small-town feel and top-tier schools. The median home value of $835,000 and median rent of $2,069 place it firmly in the upper tier of Front Range housing markets, attracting those who prioritize quality of life over affordability. Residents tend to be highly educated, with a significant share working in tech, aerospace, or Boulder’s startup ecosystem, and the town’s walkable historic downtown fosters a tight-knit, outdoor-oriented lifestyle.
Cost of living, housing, and affordability compared to nearby areas
Louisville’s cost of living index of 225 is roughly 25% higher than the Boulder metro average and nearly double that of neighboring Lafayette, making it one of the priciest zip codes in Boulder County. The median home value of $835,000 is about $100,000 above the county median and more than triple the national figure, driven by limited inventory and proximity to both Boulder (8 miles south) and Denver (25 miles southeast). Renters face a median of $2,069 per month, which is competitive with Boulder proper but significantly steeper than in Longmont or Broomfield. For context, a household earning the area’s median income of roughly $120,000 would spend about 35% of gross income on a mortgage at current rates—a stretch for many, though still feasible for dual-income professional couples. The average commute of 23.8 minutes is shorter than the Boulder County average of 27 minutes, thanks to Louisville’s central location near US-36 and the RTD Flatiron Flyer bus rapid transit line, which connects to Denver in under 40 minutes.
Local amenities, schools, and what daily life feels like
Daily life in Louisville revolves around its compact, pedestrian-friendly historic district on Main Street, where residents walk to coffee shops, breweries, and the weekly farmers market. The town’s 300+ acres of parks and open space, including the 40-mile Coal Creek Trail system, make it a haven for cyclists, runners, and dog owners. Schools are a major draw: Boulder Valley School District’s Louisville Elementary, Monarch K-8, and Monarch High School all consistently rank in the top 10% of Colorado schools, with test scores 20-30% above state averages. The Louisville Recreation & Senior Center offers a pool, fitness classes, and youth programs, while nearby Flatirons Mall and the Twenty Ninth Street shopping district in Boulder provide retail and dining options. Commuters benefit from the RTD bus service to Boulder and Denver, though most residents drive; the average commute of 23.8 minutes is manageable, with traffic congestion primarily on US-36 during peak hours. The town hosts annual events like the Louisville Street Faire and the Louisville Labor Day Parade, reinforcing a community identity that feels more like a small town than a Boulder bedroom suburb.
Louisville is best suited for professionals and families with household incomes above $150,000 who can absorb the high housing costs in exchange for excellent schools, short commutes, and immediate access to outdoor recreation. Remote workers and tech employees from Boulder or Denver will find the town’s fiber-optic internet and quiet streets appealing, while retirees on fixed incomes may struggle with the cost of living. Those seeking nightlife or urban density should look to Boulder or Denver, but for anyone who values walkability, top-ranked schools, and a strong sense of community within striking distance of the mountains, Louisville offers a compelling—if expensive—quality of life.
Crime in Louisville, CO
Lower crime rates than 80% of comparable U.S. locations.
Violent CrimeViolent Crime Analysis
Property CrimeProperty Crime Analysis
Crime Analysis
Louisville, Colorado, presents a crime profile that is notably lower than national averages for violent offenses but elevated for property crime, creating a mixed safety picture for prospective residents. With a violent crime rate of 106.2 per 100,000 residents and a property crime rate of 1,525.5 per 100,000, the city is statistically safer than many comparably sized suburbs. However, the broader context of Boulder County's progressive criminal justice policies introduces a significant concern for public safety that potential movers should weigh carefully.
Crime in context
Louisville's violent crime rate is roughly 70% lower than the national average, making serious offenses like homicide, robbery, and aggravated assault rare events. Property crime, however, tells a different story. At 1,525.5 per 100,000, Louisville's property crime rate sits above the Colorado state average and is roughly on par with the national figure. This means theft, burglary, and motor vehicle theft occur with enough frequency to be a practical concern for homeowners and renters. The disparity between low violent crime and elevated property crime is a pattern seen in many affluent Front Range suburbs, where opportunistic theft targets vehicles and packages.
What residents experience
Daily life in Louisville feels safe for most residents, with well-lit downtown streets and active neighborhood watch programs. However, the city's location within Boulder County means it falls under the jurisdiction of a district attorney's office widely regarded as progressive. This prosecutorial philosophy, which emphasizes diversion programs and reduced sentencing for non-violent offenders, has a direct impact on property crime. Repeat offenders face fewer consequences, and the likelihood of incarceration for theft or burglary is lower than in more conservative jurisdictions. For residents, this translates into a frustrating cycle: stolen bikes, car break-ins, and package thefts are common complaints on local social media, yet arrests and convictions remain infrequent. The justice system's focus on rehabilitation over punishment, while well-intentioned, creates a permissive environment that emboldens property criminals.
Neighborhood-level variation
Safety is not uniform across Louisville. The historic downtown core and newer developments like Coal Creek Ranch see lower crime rates due to higher foot traffic and private security patrols. In contrast, areas near U.S. Highway 36 and the McCaslin Boulevard corridor experience more property crime, particularly vehicle break-ins and theft from parked cars. The Lafayette border neighborhoods also report higher incident rates, as criminals exploit jurisdictional boundaries. For the most current block-level data, the Louisville Police Department publishes an interactive crime map, and prospective renters or buyers should review it before committing to a specific address. While violent crime is not a major concern anywhere in the city, property crime is a persistent nuisance that requires proactive prevention measures like security cameras and locked garages.
* Values derived from national, state, county, city and local statistics and may differ in a specific area. Last updated: 2026-05-01T12:44:52.000Z
Narrative content on this page is AI-generated and may contain mistakes. Verify any details that matter before acting on them.
ReloMaps may earn a commission from affiliate links at no extra cost to you.