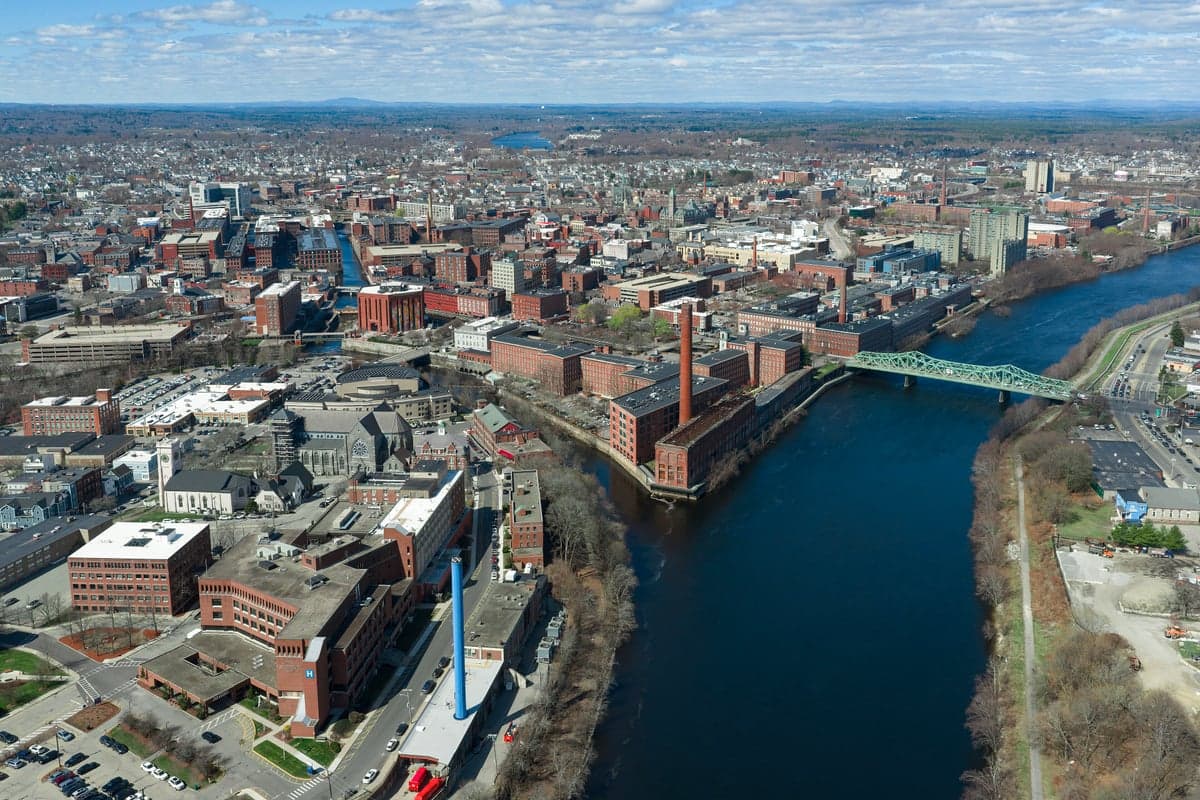
Photo: Wikipedia
Quality of Life in Lowell, MA
A high quality of life with strong walkability, manageable living costs, healthy neighborhood signals, and solid amenity access.
What does Quality of Life tell us?
Quality of Life blends cost of living, nearby amenities, socioeconomic signals, and neighborhood character. City-level scores represent the whole municipality; individual neighborhoods can differ.
What does this tell us?
Quality of Life blends cost of living, nearby amenities, socioeconomic signals, and neighborhood character. City-level scores represent the whole municipality; individual neighborhoods can differ.
Cost of Living
39% above national average
The Real Cost of Living in Lowell, MA for 2026
| Tier | Individual | Family (4) |
|---|---|---|
| Survival | $26k | $48k |
| Comfortable | $77k | $113k |
| Luxury | $128k+ | $198k+ |
| Elite (Top 5%) | $150k+ | $233k+ |
68%
The Area Signal
A metric tracking the socioeconomic signals of the area.
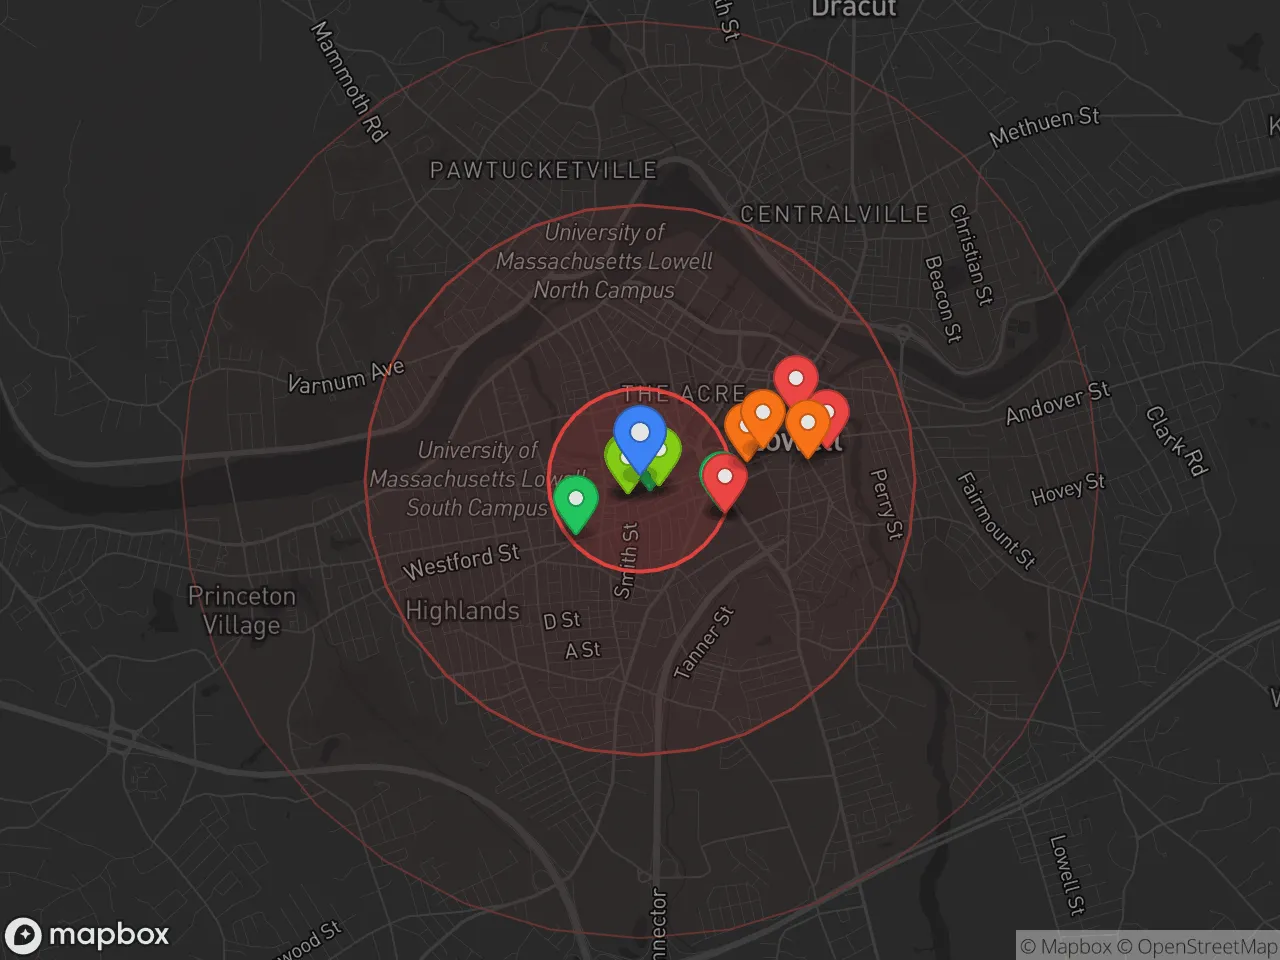
Hobbies
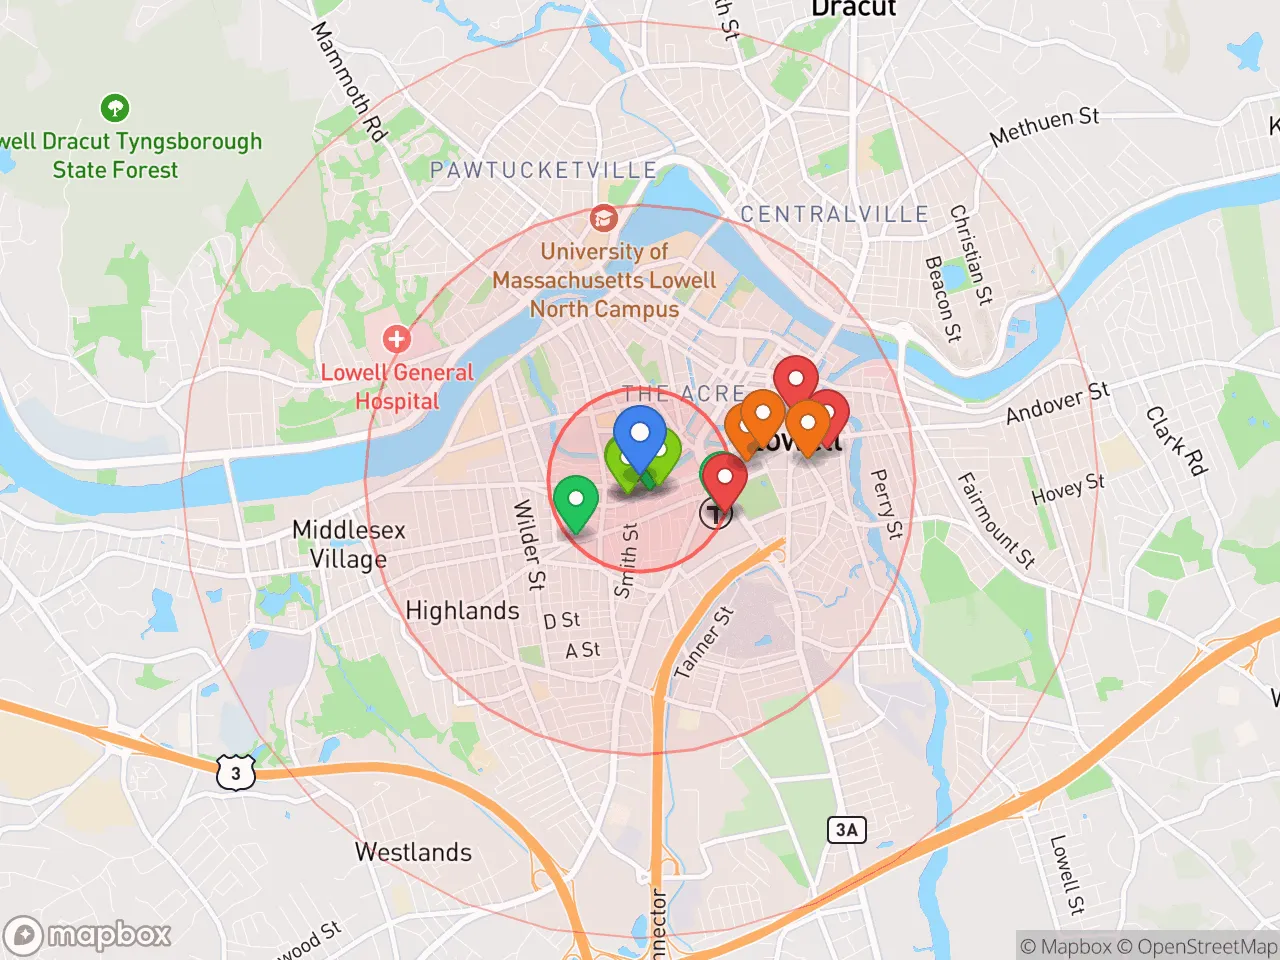
Explore the areaGroceries
4 within 10 miles
Gas
20 within 10 miles
Hospital
20 within 20 miles
Airport
PDX — Portland International Jetport
Post Office
USPS — Lowell, MA
Critical Amenities
Quality-of-Life Analysis
Lowell, Massachusetts, presents a quality-of-life profile that blends historic mill-city character with the economic pressures of the Greater Boston region. The city’s cost of living index of 139 (100 = U.S. average) places it well above the national norm, yet it remains a more attainable alternative to Boston proper, attracting a diverse mix of young professionals, families, and long-term residents. The population skews younger and more ethnically diverse than many surrounding suburbs, with a strong Cambodian-American community and a growing cohort of commuters drawn by the city’s relative affordability and its direct MBTA Commuter Rail connection to Boston’s North Station.
Cost of living, housing affordability, and how Lowell compares to nearby towns
Lowell’s housing market is the primary driver of its elevated cost of living, though it still undercuts many neighboring communities. The median home value of $395,100 is roughly 30% lower than the median in nearby Lexington or Winchester, making it one of the more accessible entry points for homebuyers in Middlesex County. Median rent sits at $1,603, which is below the state average of roughly $1,800 and significantly less than the $2,500+ typical in Cambridge or Somerville. However, these figures still represent a substantial burden for households earning the area median income; a renter would need to earn approximately $64,000 annually to avoid being cost-burdened under standard affordability guidelines. Property taxes in Lowell are moderate for Massachusetts, with an effective rate around 1.4%, but the overall cost of goods and services—from groceries to utilities—consistently runs 10–15% above national averages. For those willing to accept a longer commute, towns like Dracut or Tewksbury offer slightly lower home prices, though they lack Lowell’s walkable downtown and transit access.
What daily life is like: amenities, schools, and the local rhythm
Daily life in Lowell revolves around its compact, walkable downtown core along the Merrimack River, where the Lowell National Historical Park preserves the city’s industrial heritage. The city’s public school system, Lowell Public Schools, serves roughly 14,000 students and includes several magnet programs, though it has faced challenges with funding and proficiency rates that lag behind suburban districts like Chelmsford or Andover. For families, the presence of the University of Massachusetts Lowell adds a college-town energy, with public lectures, Division I athletics, and cultural events open to residents. The average commute time of 27.5 minutes is shorter than the Boston metro average of 31 minutes, a benefit of Lowell’s position as a regional employment hub with its own hospitals, tech firms, and manufacturing base. The city’s network of parks—including the 10-mile Bruce Freeman Rail Trail and the Concord River Greenway—provides outdoor recreation within walking distance of most neighborhoods. Restaurants and breweries have proliferated along Merrimack Street and Market Street, giving the downtown a lively evening scene that contrasts with the quieter residential wards of the Highlands and Belvidere neighborhoods.
Lowell is best suited for individuals and families who prioritize urban amenities, transit connectivity, and cultural diversity over suburban school rankings or low crime rates. Commuters who work in Boston or along the I-495 corridor will find the 27-minute average drive or the 45-minute train ride to North Station a manageable trade-off for lower housing costs. The city’s strong sense of community identity—rooted in its immigrant history and revitalized arts scene—appeals to those who value walkable neighborhoods and local institutions over cookie-cutter subdivisions. However, households seeking top-tier public schools, expansive single-family lots, or very low property taxes will likely find better fits in the outer suburbs of Nashua, New Hampshire, or rural Middlesex County towns. For the right resident, Lowell offers a rare combination of historic character, economic opportunity, and relative affordability within one of the nation’s most expensive metro areas.
Crime in Lowell, MA
Generally safer than 62% of comparable U.S. locations.
Violent CrimeViolent Crime Analysis
Property CrimeProperty Crime Analysis
Crime Analysis
Lowell, Massachusetts, reports a violent crime rate of 409.8 incidents per 100,000 residents and a property crime rate of 1,185.7 per 100,000, placing it above both state and national averages for public safety risk. These figures indicate that while the city is not among the most dangerous in the region, residents and prospective movers should be aware of elevated crime levels compared to surrounding suburbs like Chelmsford or Tewksbury. The overall safety picture is mixed, with certain areas requiring heightened vigilance, particularly during evening hours.
Crime in context
Lowell's violent crime rate of 409.8 per 100,000 is roughly 17% higher than the national average of approximately 350 per 100,000 and significantly exceeds the Massachusetts state average of about 300 per 100,000. Property crime, at 1,185.7 per 100,000, also outpaces the national benchmark of roughly 1,100 per 100,000 and is notably higher than the state average of around 900 per 100,000. These statistics place Lowell in a higher-risk tier among Massachusetts cities, comparable to Lawrence but lower than Springfield. A key contributing factor is the influence of progressive judicial policies in Middlesex County, where district attorneys and judges often prioritize diversion programs and reduced sentencing over incarceration. This approach, while intended to reduce recidivism, has been criticized for keeping repeat offenders on the streets, directly undermining public safety and victim justice.
What residents experience
Residents commonly report property crimes such as vehicle break-ins, package theft, and vandalism as the most frequent nuisances, particularly in densely populated neighborhoods near the downtown area and the University of Massachusetts Lowell campus. Violent incidents, including aggravated assaults and robberies, are more concentrated in specific corridors like the Acre and Centralville sections, often linked to gang activity or drug-related disputes. Daytime safety is generally acceptable in commercial and residential areas, but after dark, foot traffic in isolated streets and parks carries elevated risk. The progressive legal environment means that many arrested individuals face minimal jail time, leading to a perception among long-term residents that the justice system fails to deter crime effectively.
Neighborhood-level variation
Safety varies sharply by neighborhood. The Belvidere and Highlands areas, with higher home values and stronger community policing, experience significantly lower crime rates than the city average. In contrast, the Acre and Lower Highlands see the highest concentration of both violent and property offenses. Prospective renters and buyers should research block-level crime maps and consider that even within a generally safe street, a nearby intersection may have frequent police calls. The city's ongoing revitalization efforts in the Hamilton Canal District have not yet meaningfully shifted overall crime trends, and the progressive judicial climate remains a persistent concern for those prioritizing personal and family safety.
* Values derived from national, state, county, city and local statistics and may differ in a specific area. Last updated: 2026-05-02T01:37:53.000Z
Narrative content on this page is AI-generated and may contain mistakes. Verify any details that matter before acting on them.
ReloMaps may earn a commission from affiliate links at no extra cost to you.