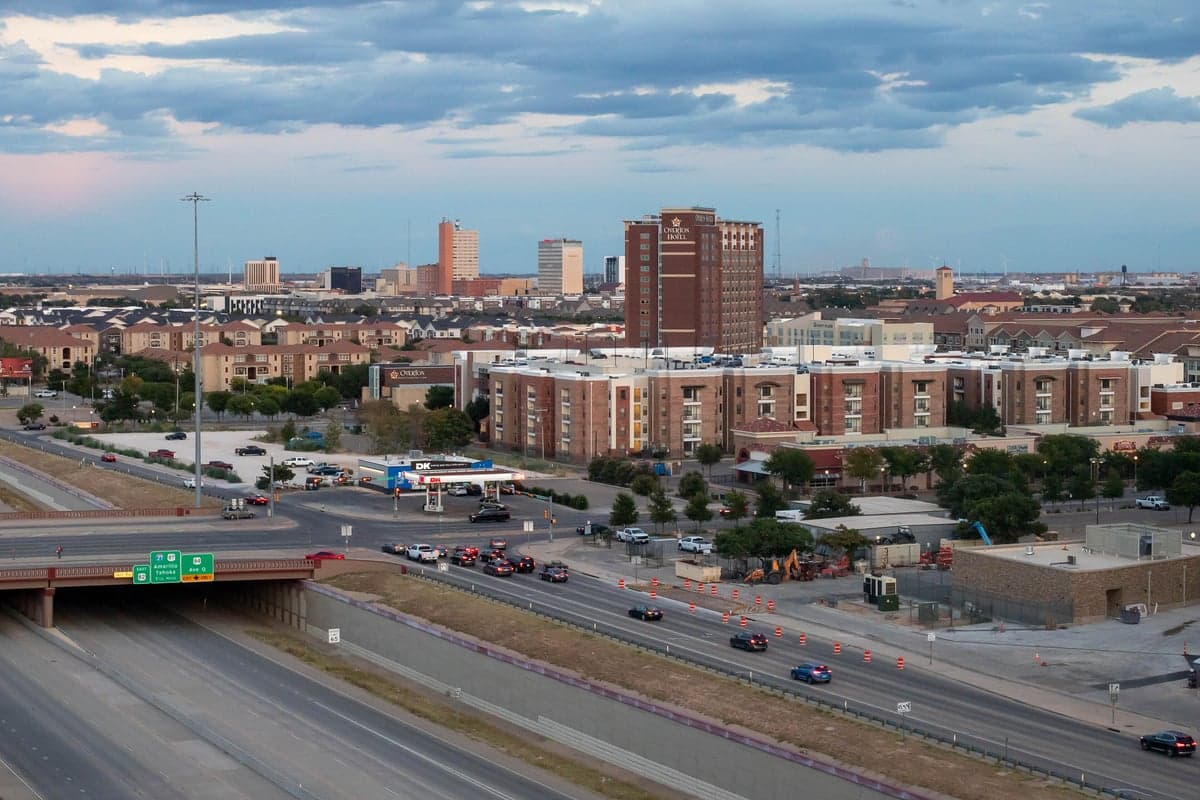
Photo: Wikipedia
Quality of Life in Lubbock, TX
Above-average quality of iife. The area offers a reasonable cost of living, decent mobility, and a mix of neighborhood amenities.
What does Quality of Life tell us?
Quality of Life blends cost of living, nearby amenities, socioeconomic signals, and neighborhood character. City-level scores represent the whole municipality; individual neighborhoods can differ.
What does this tell us?
Quality of Life blends cost of living, nearby amenities, socioeconomic signals, and neighborhood character. City-level scores represent the whole municipality; individual neighborhoods can differ.
Cost of Living
13% below national average
The Real Cost of Living in Lubbock, TX for 2026
| Tier | Individual | Family (4) |
|---|---|---|
| Survival | $34k | $64k |
| Comfortable | $57k | $83k |
| Luxury | $109k+ | $169k+ |
| Elite (Top 5%) | $143k+ | $222k+ |
73%
The Area Signal
A metric tracking the socioeconomic signals of the area.


Hobbies
Explore the areaGroceries
5 within 10 miles
Gas
0 within 10 miles
Hospital
3 within 20 miles
Airport
SAN — San Angelo Regional
Post Office
USPS — Lubbock, TX
Critical Amenities
Quality-of-Life Analysis
Lubbock, Texas, offers a quality of life defined by its status as a regional economic and educational hub, attracting a mix of families, Texas Tech University students and faculty, and professionals in healthcare and agriculture. With a cost of living index of 87—13% below the national average—the city provides a notably affordable environment that contrasts sharply with pricier Texas metros like Austin or Dallas. The population skews younger and more transient than the state average due to the university's influence, yet a stable core of long-term residents anchors the community around its ranching and cotton-farming heritage.
How housing costs and affordability compare to nearby cities
Lubbock's affordability is its strongest draw for newcomers. The median home value sits at $197,900, roughly half the national median and significantly lower than in Midland ($280,000+) or Amarillo ($210,000). Median rent is $1,137, making it feasible for single professionals and students to live alone without roommates. The average commute of just 16.2 minutes is among the shortest in Texas, meaning residents spend less on gas and vehicle wear-and-tear than in sprawling cities like Houston or Fort Worth. Property taxes in Lubbock County average around 2.3% of assessed value, which is typical for Texas but partially offset by the lower home prices. Compared to the nearby smaller towns of Plainview or Levelland, Lubbock offers more housing variety—from historic bungalows near the Texas Tech campus to newer subdivisions in Southwest Lubbock—without a major price premium.
What daily life is like for families and professionals
Daily life in Lubbock revolves around Texas Tech University, which anchors the city's cultural and employment landscape. The Lubbock Independent School District operates 56 campuses, with standout options like Lubbock High School and the magnet Talkington School for Young Women Leaders. For families, the city offers over 40 parks, the Science Spectrum museum, and Prairie Dog Town in Mackenzie Park—a unique free attraction. The arts scene is modest but active, anchored by the Buddy Holly Center and the Lubbock Symphony Orchestra. Dining leans heavily toward Texas staples: barbecue, Tex-Mex, and steakhouse chains, with local favorites like Evie Mae's Pit Barbecue and The Cast Iron Grill. The climate is semi-arid, with hot summers averaging 93°F and mild winters around 50°F, though frequent high winds and occasional dust storms can be a drawback. Retail and services are concentrated along South Loop 289 and West 82nd Street, giving the city a car-dependent but uncongested feel.
Who thrives in Lubbock? The city best suits those who value low housing costs, short commutes, and a slower pace over urban density and nightlife. It is a strong fit for Texas Tech students and staff, healthcare workers at Covenant Health or UMC Health System, and agricultural professionals tied to the region's cotton and cattle industries. Families seeking affordable homeownership and a safe, community-oriented environment will find it appealing, though those accustomed to coastal amenities or diverse dining scenes may feel limited. Retirees on fixed incomes also benefit from the low cost of living, provided they can tolerate the extreme weather swings. Lubbock is not a destination for trend-seekers, but for pragmatic residents who prioritize financial stability and a straightforward daily routine, it delivers reliably.
Crime in Lubbock, TX
Higher crime rates than 65% of comparable U.S. locations.
Violent CrimeViolent Crime Analysis
Property CrimeProperty Crime Analysis
Crime Analysis
Lubbock, Texas, reports a violent crime rate of 654.7 incidents per 100,000 residents and a property crime rate of 2,363.7 per 100,000, figures that place the city well above both state and national averages. While Lubbock is not a large metro area like Dallas or Houston, its status as the economic and cultural hub of the South Plains means its crime patterns reflect a concentrated urban core with significant safety challenges. The city’s justice system, influenced by the broader political climate of Lubbock County, has not adopted the progressive prosecutorial policies seen in some larger Texas counties, but residents still face elevated risks compared to smaller surrounding communities.
Crime in context
Lubbock’s violent crime rate is roughly 75% higher than the national average and significantly exceeds the Texas state average of approximately 445 per 100,000. Property crime in Lubbock also runs about 20% above the national benchmark. These numbers place Lubbock in a tier with other mid-sized Texas cities like Amarillo and Waco, though it remains safer than the most dangerous large metros such as Memphis or St. Louis. Notably, Lubbock’s crime rates have remained relatively stable over the past five years, with no dramatic spikes or declines, suggesting a persistent structural issue rather than a temporary surge. The city’s police department has maintained a conservative approach to enforcement, and local district attorneys have not adopted the progressive sentencing reforms—such as cash bail elimination or reduced prosecution of nonviolent offenses—that have been linked to rising crime in jurisdictions like San Francisco or Philadelphia.
What residents experience
For daily life in Lubbock, property crime—particularly vehicle burglary and theft—is the most common concern. Residents in central neighborhoods near Texas Tech University report higher rates of bicycle theft and package theft, while suburban areas like Southwest Lubbock see more residential burglaries. Violent crime, while less frequent, is concentrated in specific corridors: the area around Avenue Q and 34th Street, and parts of East Lubbock near Martin Luther King Jr. Boulevard. Most violent incidents involve individuals known to each other rather than random attacks, but the elevated rate means residents should remain vigilant, especially at night. The city’s police response times average around 8-10 minutes for priority calls, which is competitive for a city of its size. Lubbock also benefits from a strong neighborhood watch network, with over 60 active programs across the city.
Neighborhood-level variation is significant. The safest areas are the newer developments in Southwest Lubbock (zip codes 79424 and 79423), where violent crime rates drop to under 200 per 100,000. In contrast, the central and eastern parts of the city (79415, 79403) see rates exceeding 1,000 per 100,000. The Texas Tech campus itself maintains a relatively low crime rate due to dedicated campus police and controlled access, but the surrounding off-campus student housing areas experience higher property crime. For those considering relocation, focusing on neighborhoods south of Loop 289 and west of University Avenue generally offers the best safety profile, while avoiding the older, denser areas near downtown and the railroad corridors reduces exposure to both violent and property crime.
* Values derived from national, state, county, city and local statistics and may differ in a specific area. Last updated: 2026-04-14T20:02:39.000Z
Narrative content on this page is AI-generated and may contain mistakes. Verify any details that matter before acting on them.
ReloMaps may earn a commission from affiliate links at no extra cost to you.