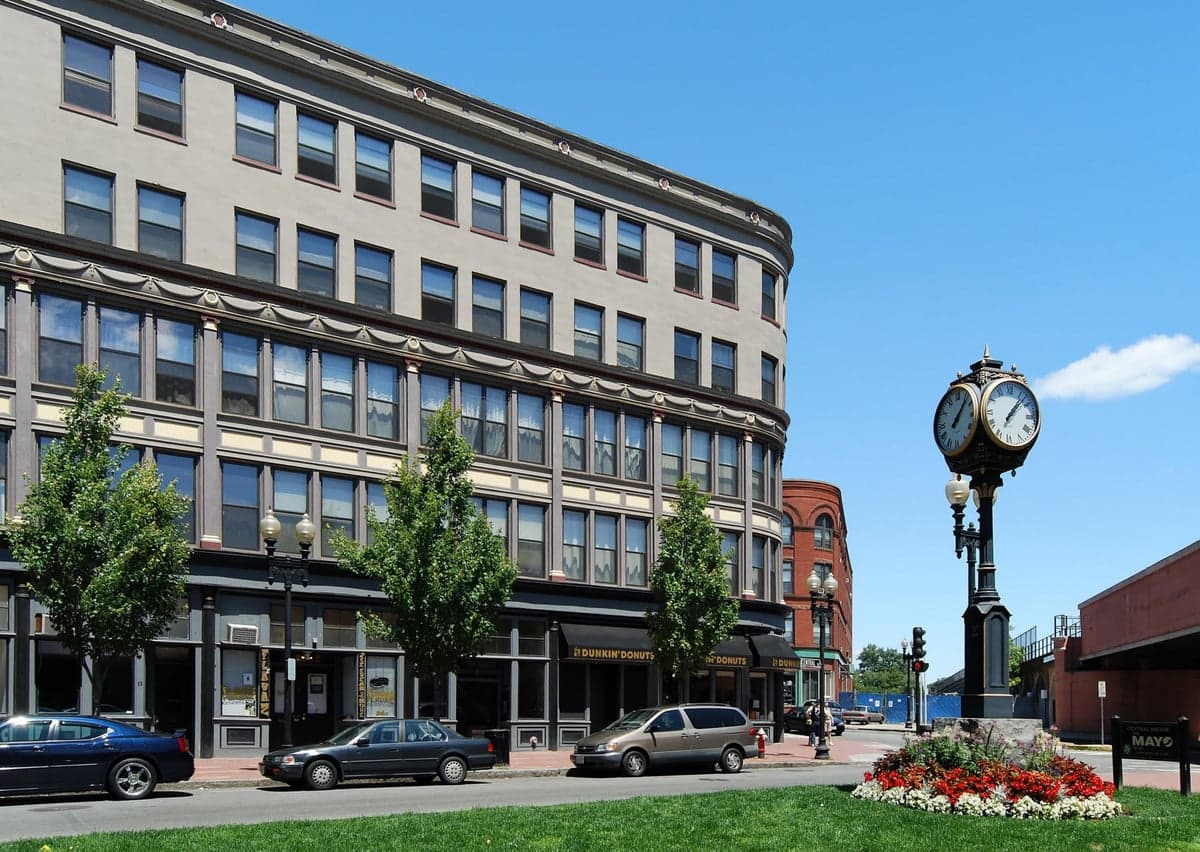


Photo: Wikipedia
Quality of Life in Lynn, MA
A high quality of life with strong walkability, manageable living costs, healthy neighborhood signals, and solid amenity access.
What does Quality of Life tell us?
Quality of Life blends cost of living, nearby amenities, socioeconomic signals, and neighborhood character. City-level scores represent the whole municipality; individual neighborhoods can differ.
What does this tell us?
Quality of Life blends cost of living, nearby amenities, socioeconomic signals, and neighborhood character. City-level scores represent the whole municipality; individual neighborhoods can differ.
Cost of Living
50% above national average
The Real Cost of Living in Lynn, MA for 2026
| Tier | Individual | Family (4) |
|---|---|---|
| Survival | $26k | $48k |
| Comfortable | $88k | $129k |
| Luxury | $129k+ | $200k+ |
| Elite (Top 5%) | $152k+ | $235k+ |
58%
The Area Signal
A metric tracking the socioeconomic signals of the area.
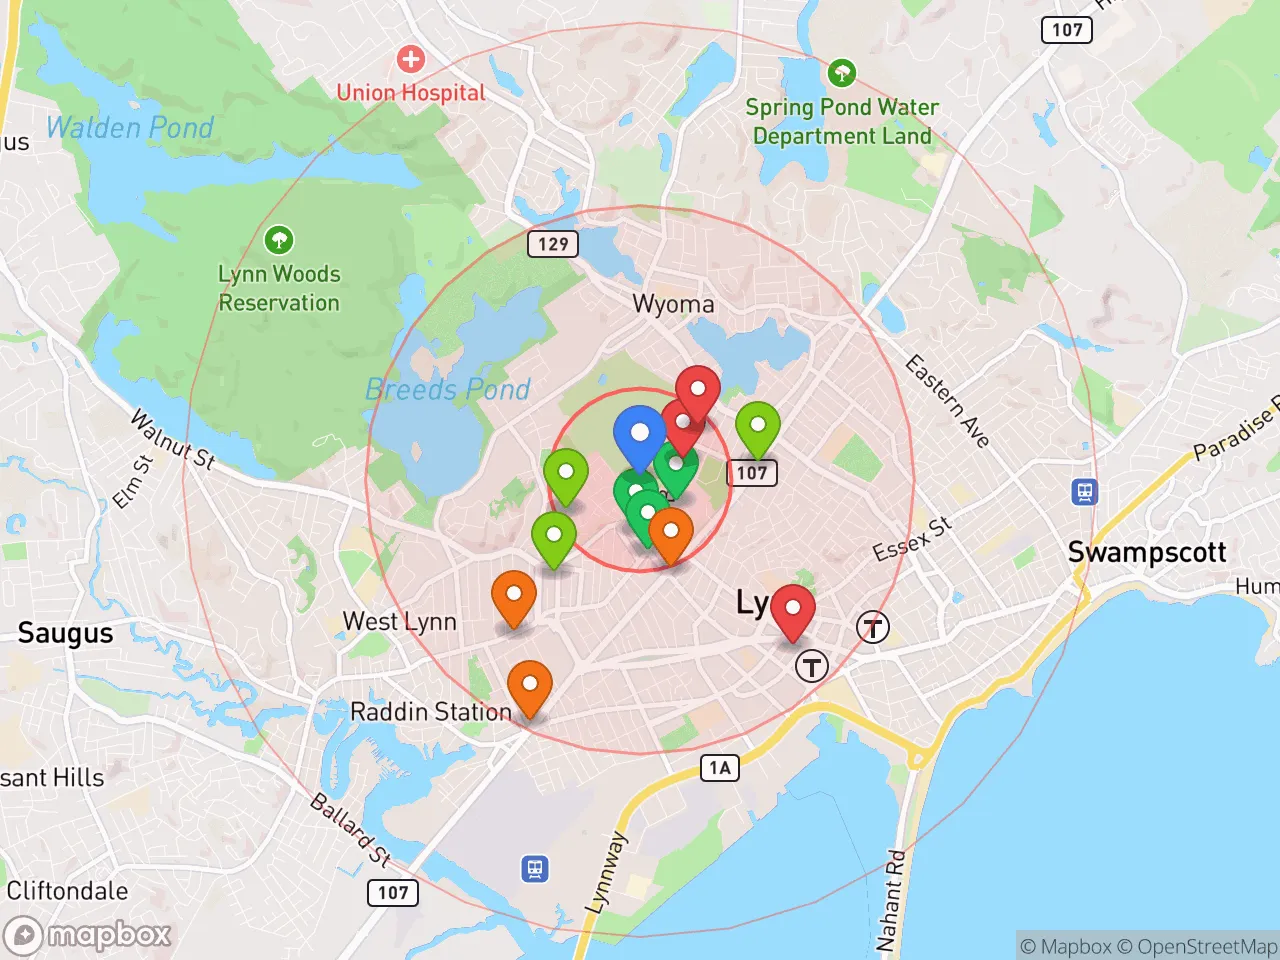
Hobbies
Explore the areaGroceries
7 within 10 miles
Gas
20 within 10 miles
Hospital
20 within 20 miles
Airport
PDX — Portland International Jetport
Post Office
USPS — Lynn, MA
Critical Amenities
Quality-of-Life Analysis
Lynn, Massachusetts, presents a quality-of-life profile that is distinctly more affordable than its North Shore neighbors while still offering direct access to the Boston metro economy. With a cost-of-living index of 150 (50% above the U.S. average), the city sits well below the stratospheric levels of nearby Swampscott, Marblehead, and downtown Boston, attracting a mix of young professionals, long-term working-class families, and recent immigrants who value urban proximity without the premium price tag. The median home value of $472,600 and median rent of $1,612 create a housing market that is expensive by national standards but represents one of the last relative bargains within commuting distance of Boston’s job centers.
How housing costs and affordability compare to Boston and the North Shore
Lynn’s housing market is the city’s most defining quality-of-life factor. A median home value of $472,600 is roughly half the median in neighboring Swampscott ($900,000+) and less than a third of the Boston citywide median. Median rent of $1,612 undercuts the Boston metro average by about $600 per month, making Lynn one of the few communities in Essex County where a one-bedroom apartment remains accessible to households earning the area median income. However, the cost-of-living index of 150 means everyday expenses—groceries, utilities, transportation—run significantly above the national baseline. Property taxes in Lynn are moderate for Massachusetts (roughly $4,500 annually on the median home), but buyers should note that older housing stock often requires renovation investment. The trade-off is clear: residents accept an average commute of 31.3 minutes (slightly above the national average but below Boston’s 34-minute mean) in exchange for housing costs that allow savings or discretionary spending that would be impossible in pricier suburbs.
What daily life is like: schools, parks, and local amenities
Daily life in Lynn revolves around a dense, walkable urban core and a coastline that punches above its weight. The city’s public school system, Lynn Public Schools, serves roughly 14,000 students and has faced chronic underfunding challenges, though magnet programs at Lynn Classical and Lynn English High Schools draw families seeking college-prep tracks. For recreation, Lynn Woods Reservation (2,200 acres) and Nahant Beach provide free outdoor access rare in a city this close to Boston. The commuter rail station on the Newburyport/Rockport line reaches North Station in 25–40 minutes, a key amenity for professionals working in the Seaport or Financial District. Retail and dining are concentrated along Market Street and the Lynnway, with a growing number of Latin American and Caribbean restaurants reflecting the city’s diverse population—over 40% of residents are foreign-born. Grocery access is adequate but not premium; major chains like Stop & Shop and Market Basket serve most neighborhoods, while specialty markets cluster in the downtown area. The city’s crime rate remains above the Massachusetts average, particularly for property crime, though violent crime has declined steadily since 2020. Families with children often weigh the school quality trade-off against the housing savings, while singles and couples without kids tend to prioritize the commute and cultural diversity.
Lynn is best suited for residents who value affordability, urban energy, and transit connectivity over suburban school rankings or low-crime statistics. Young professionals commuting to Boston, immigrant families building roots in a diverse community, and empty-nesters seeking walkable access to the coast will find the city’s trade-offs worthwhile. Those who prioritize top-tier public schools, low property taxes, or a quiet suburban environment will likely prefer Swampscott, Peabody, or Salem. For the right household, Lynn offers a quality of life that balances financial practicality with genuine urban character—a combination increasingly rare in Greater Boston.
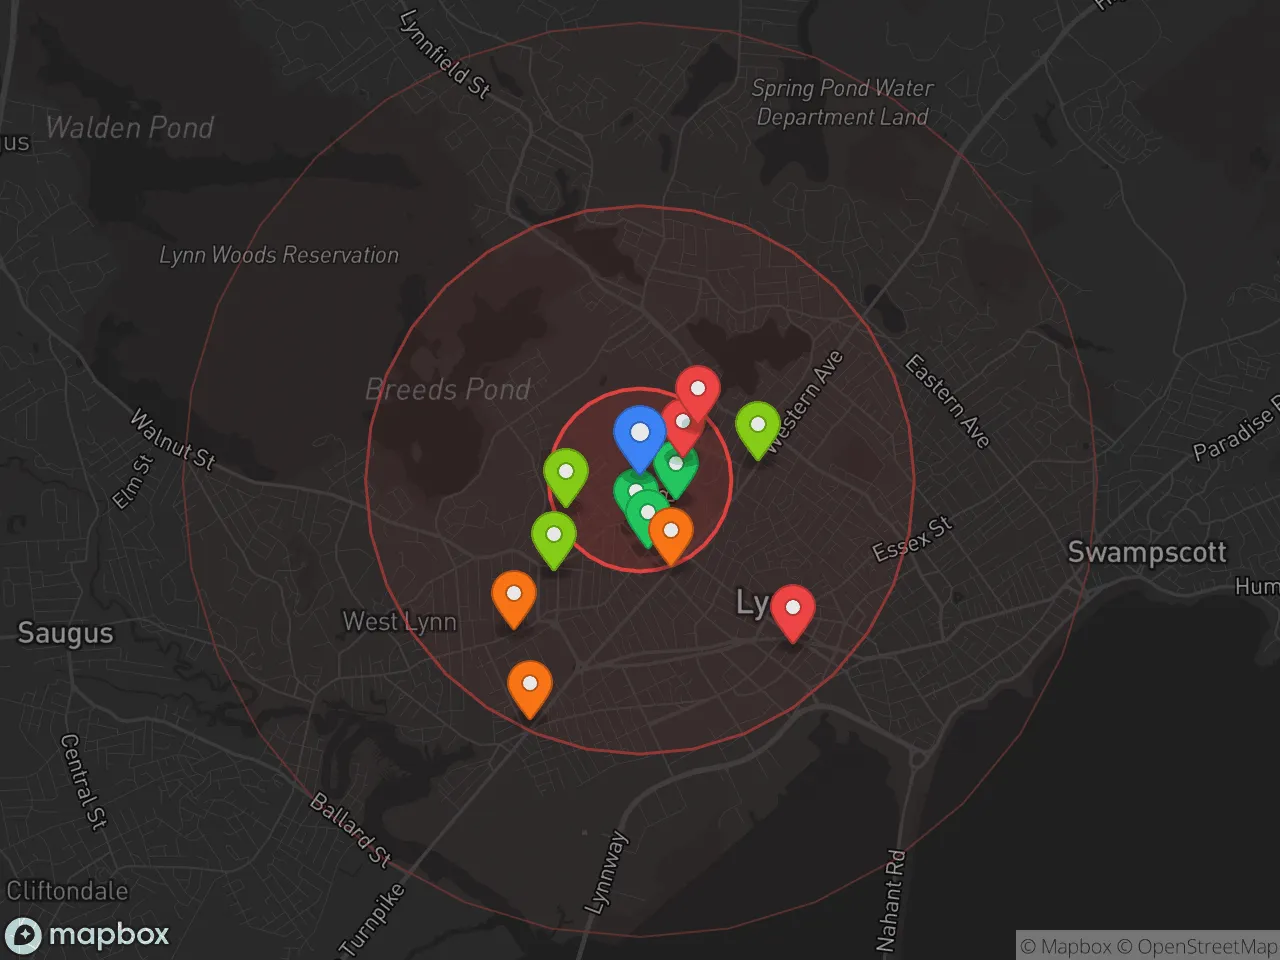
Crime in Lynn, MA
Crime rates similar to the national median for U.S. locations.
Violent CrimeViolent Crime Analysis
Property CrimeProperty Crime Analysis
Crime Analysis
Lynn, Massachusetts, presents a crime and safety profile that warrants careful consideration for potential residents, particularly given its location within the broader Boston metro area. The city's violent crime rate stands at 548.1 incidents per 100,000 residents, while property crime occurs at a rate of 1,091.3 per 100,000. These figures place Lynn in a category of elevated risk compared to both state and national averages, a situation compounded by the progressive judicial policies common in Massachusetts' large metro counties.
Crime in context
Lynn's violent crime rate is roughly 1.5 times the national average and significantly higher than the Massachusetts state average, which is among the lowest in the country. The property crime rate, while closer to the national norm, still exceeds the state average by a considerable margin. This disparity is partly attributable to the judicial environment in Essex County and the broader Greater Boston area, where liberal-leaning district attorneys and judges often prioritize diversion programs and reduced sentencing. While these policies aim to address root causes of crime, they frequently result in repeat offenders cycling back onto the streets, directly undermining public safety and victim justice. For context, nearby Salem and Swampscott report lower crime rates, highlighting Lynn's outlier status within the region.
What residents experience
For those living in Lynn, the statistical risk translates into tangible daily concerns. Property crimes like larceny, motor vehicle theft, and burglary are the most common incidents, often concentrated in commercial corridors and densely populated residential areas. Violent crime, including aggravated assault and robbery, is less frequent but more impactful, with certain neighborhoods experiencing periodic spikes. Residents frequently cite concerns about open-air drug activity and gang-related incidents, particularly in the downtown and eastern sections of the city. The presence of a progressive district attorney's office means that even when arrests are made, the likelihood of swift, meaningful prosecution is lower than in more conservative jurisdictions, a factor that erodes community trust and emboldens offenders.
Neighborhood-level variation
Safety in Lynn is not uniform. The Diamond District, encompassing the area around Lynn Woods and the golf course, is generally considered the safest, with lower crime rates and a more suburban feel. Conversely, the Downtown and West Lynn neighborhoods experience higher concentrations of both property and violent crime, particularly around the commuter rail station and along major thoroughfares like Western Avenue and Broadway. The Pine Hill and Ward 4 areas fall in between, with moderate crime rates that fluctuate based on seasonal and economic factors. Prospective renters and buyers should research block-level crime maps and consider visiting at different times of day to gauge the actual safety environment, as the city's overall statistics mask significant intra-city disparities.
* Values derived from national, state, county, city and local statistics and may differ in a specific area. Last updated: 2026-05-01T18:57:10.000Z
Narrative content on this page is AI-generated and may contain mistakes. Verify any details that matter before acting on them.
ReloMaps may earn a commission from affiliate links at no extra cost to you.