
Photo: Wikipedia
Quality of Life in Lynnwood, WA
Above-average quality of iife. The area offers a reasonable cost of living, decent mobility, and a mix of neighborhood amenities.
What does Quality of Life tell us?
Quality of Life blends cost of living, nearby amenities, socioeconomic signals, and neighborhood character. City-level scores represent the whole municipality; individual neighborhoods can differ.
What does this tell us?
Quality of Life blends cost of living, nearby amenities, socioeconomic signals, and neighborhood character. City-level scores represent the whole municipality; individual neighborhoods can differ.
Cost of Living
77% above national average
The Real Cost of Living in Lynnwood, WA for 2026
| Tier | Individual | Family (4) |
|---|---|---|
| Survival | $27k | $50k |
| Comfortable | $90k | $132k |
| Luxury | $132k+ | $204k+ |
| Elite (Top 5%) | $155k+ | $240k+ |
58%
The Area Signal
A metric tracking the socioeconomic signals of the area.
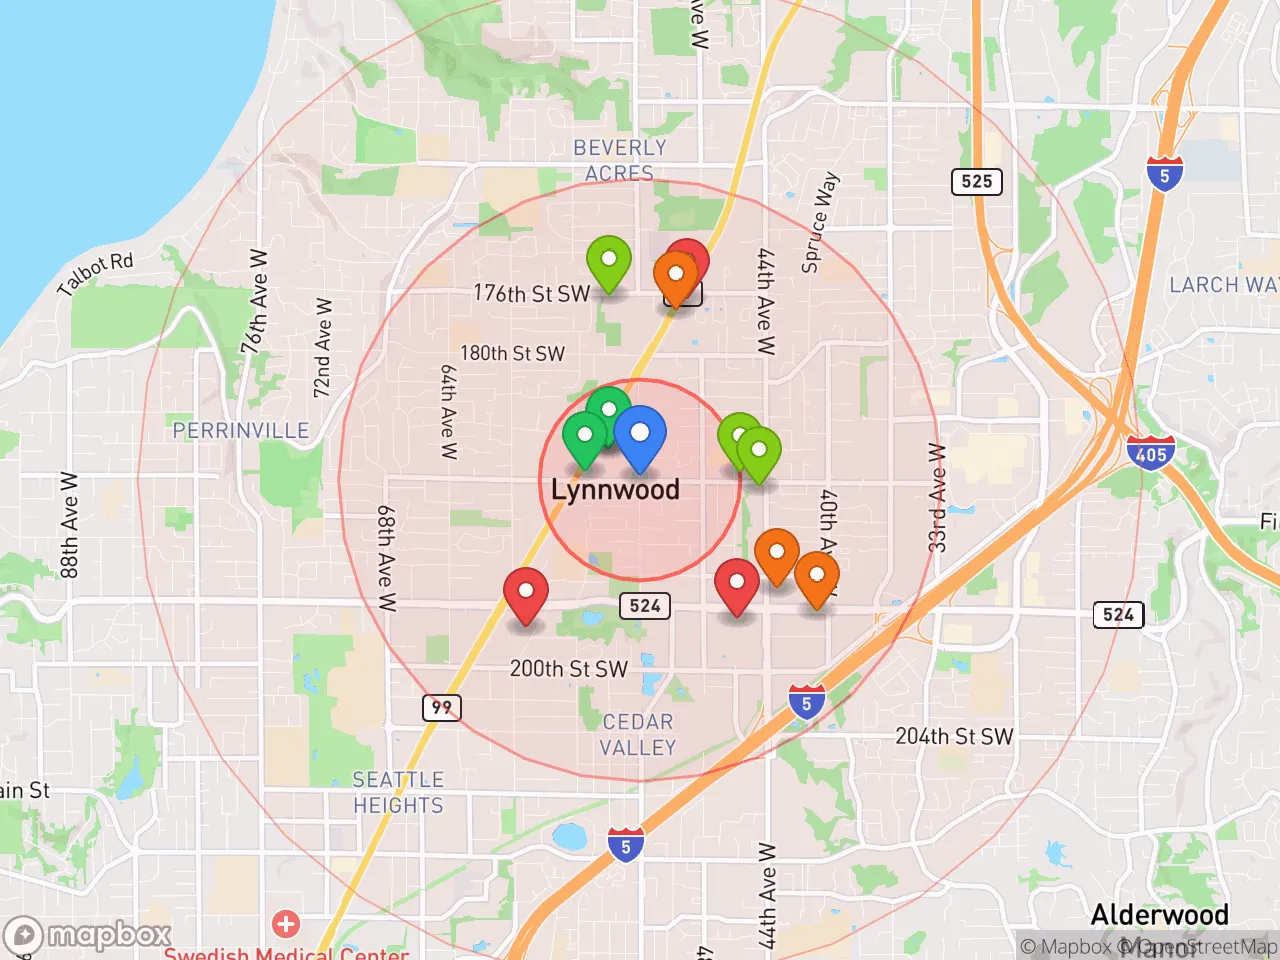
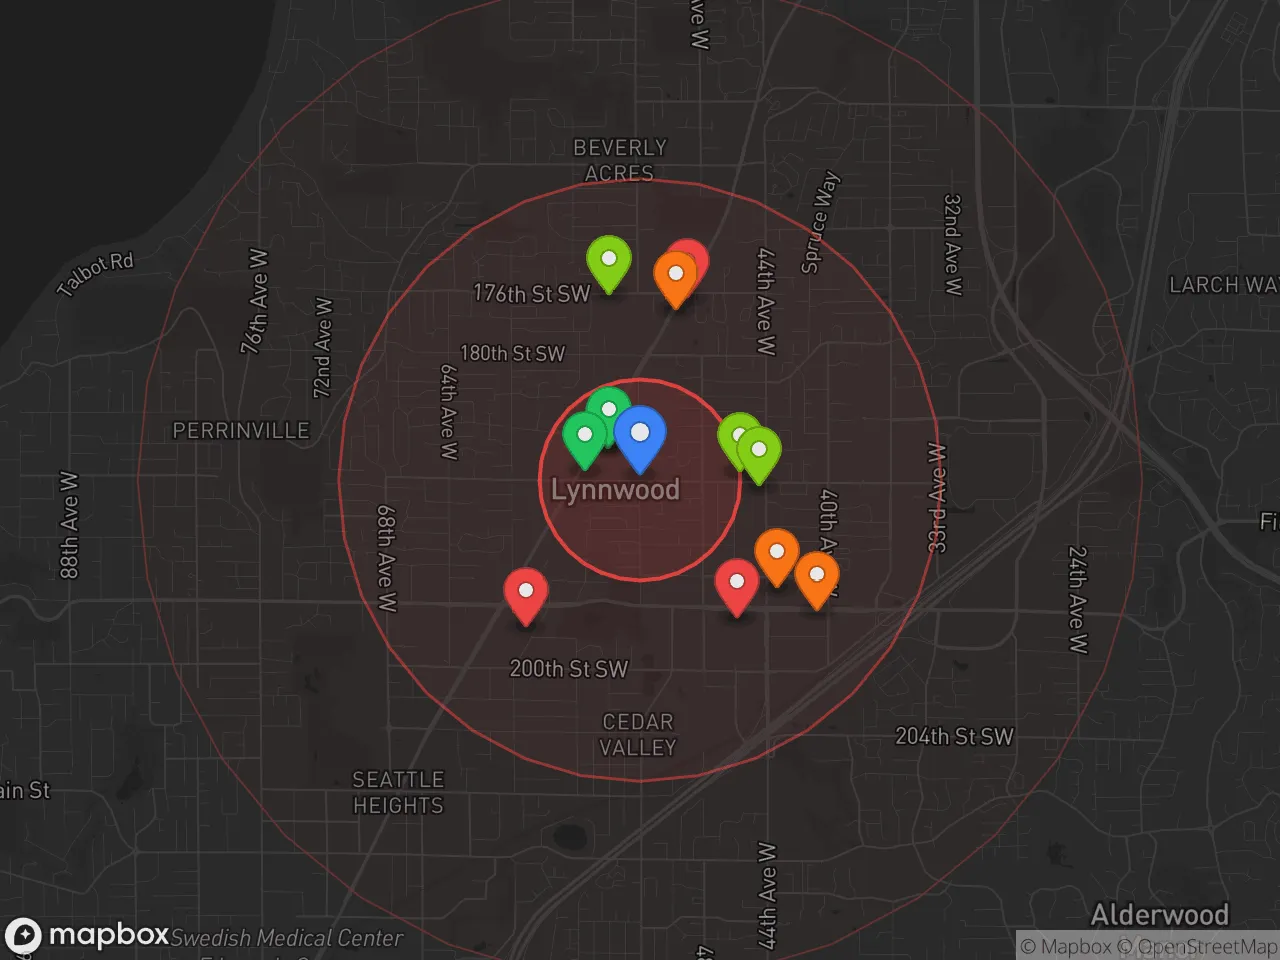
Hobbies
Explore the areaGroceries
9 within 10 miles
Gas
20 within 10 miles
Hospital
20 within 20 miles
Airport
SEA — Seattle–Tacoma International
Post Office
USPS — Lynnwood, WA
Critical Amenities
Quality-of-Life Analysis
Lynnwood, Washington, presents a middle-to-upper-middle-class suburban lifestyle within the Seattle metropolitan area, attracting a mix of young professionals, established families, and long-term residents who trade urban density for more space and relative affordability. With a cost of living index of 177—well above the national average of 100—the city is notably less expensive than Seattle proper (index ~200+) but still carries a premium compared to more distant Snohomish County towns like Marysville or Arlington. The population skews toward working-age adults, many of whom commute into King County, and the city’s demographic profile reflects a growing diversity, with significant Asian and Hispanic communities shaping local culture and commerce.
Cost of living, housing affordability, and how Lynnwood compares to Seattle and Everett
Lynnwood’s cost of living is driven primarily by housing, though it remains a relative bargain for the region. The median home value sits at $635,800, roughly $200,000 less than Seattle’s median and about $50,000 below Bellevue’s, but still significantly higher than Everett’s median of around $550,000. Renters fare better: the median rent of $1,675 is about $400 less than Seattle’s average and comparable to Edmonds, though higher than in Marysville ($1,450). The average commute of 29.2 minutes reflects the city’s role as a bedroom community—most residents drive I-5 or take Community Transit buses to jobs in Seattle, Redmond, or Boeing’s Everett plant. While housing costs have risen 8-10% annually since 2020, Lynnwood still offers a lower entry point for first-time buyers than most of King County, especially in neighborhoods near Alderwood Mall or along the 196th Street corridor.
What daily life is like: amenities, schools, and the local rhythm
Daily life in Lynnwood centers on a mix of retail convenience, green space, and a steady suburban pace. The Alderwood Mall area anchors shopping and dining, with chains like REI and Nordstrom Rack alongside local eateries such as Katsu Burger and Pho Lynnwood. The city operates over 20 parks, including the 105-acre Lynnwood Golf Course and the popular Scriber Lake Park, which offers walking trails and a boardwalk. Schools are managed by the Edmonds School District, which serves Lynnwood and nearby Brier; Meadowdale High School and Alderwood Middle School consistently score above state averages in math and English, though class sizes hover around 25-28 students. The city’s transit-oriented development near the new Lynnwood Link Light Rail station (opening 2024) is reshaping the downtown core, adding apartment complexes and a pedestrian plaza that will shorten the commute to Seattle’s Capitol Hill to about 30 minutes. For families, the rhythm includes weekend soccer at Wilcox Park and summer concerts at City Park, while singles and couples often head to nearby Edmonds for waterfront dining or to Seattle for nightlife.
Lynnwood is best suited for those who want proximity to Seattle’s job market and cultural amenities without paying Seattle prices, particularly families and professionals who can absorb the higher-than-national cost of living. The city works well for commuters who value a 30-minute train or drive over a longer haul from farther suburbs, and for renters seeking a stable market with more space than downtown apartments. It is less ideal for those seeking a walkable urban core, a low-cost lifestyle, or a rural setting—those needs are better met in Seattle proper or in towns like Granite Falls or Arlington. With the light rail expansion and ongoing redevelopment of the city center, Lynnwood is transitioning from a purely suburban commuter hub into a more self-contained community, making it a pragmatic choice for the next decade of growth.
Crime in Lynnwood, WA
Crime rates similar to the national median for U.S. locations.
Violent CrimeViolent Crime Analysis
Property CrimeProperty Crime Analysis
Crime Analysis
Lynnwood, Washington, reports a violent crime rate of 266 incidents per 100,000 residents and a property crime rate of 1,829.5 per 100,000, placing it above national averages for both categories. These figures reflect a community grappling with safety challenges common to suburban cities within the Seattle metropolitan area, where regional crime trends and justice system policies influence local conditions. Prospective residents should weigh these statistics against the city's amenities and proximity to employment centers when evaluating relocation options.
Crime in context
Lynnwood's violent crime rate of 266 per 100,000 is roughly 25% higher than the national average of approximately 213 per 100,000, while its property crime rate of 1,829.5 per 100,000 exceeds the U.S. average of about 1,954 per 100,000 by a narrower margin. Compared to Washington state's overall violent crime rate of 298 per 100,000, Lynnwood fares slightly better, but its property crime rate is notably higher than the state average of roughly 2,500 per 100,000. The city's location within Snohomish County, part of the broader Seattle metro area, means it is subject to regional crime patterns, including property crimes tied to auto theft and retail theft at the Alderwood Mall corridor. Snohomish County's progressive prosecutorial policies, including diversion programs and reduced sentencing for non-violent offenses, have been cited by local law enforcement as factors that may embolden repeat offenders and limit deterrent effects, contributing to higher recidivism rates in the area.
What residents experience
Daily life in Lynnwood involves heightened vigilance around property crime, particularly vehicle break-ins, package theft, and shoplifting, which are concentrated near commercial zones like Highway 99 and the Lynnwood Transit Center. Violent crime, while less frequent, includes aggravated assaults and occasional robberies, often linked to disputes or drug-related activity. Residents report that police response times can be delayed due to staffing shortages, a challenge amplified by county-level policies that deprioritize certain low-level offenses. The presence of a progressive district attorney's office in Snohomish County, which emphasizes rehabilitation over incarceration, has led to criticism from community safety advocates who argue that lenient sentencing cycles criminals back onto the streets without meaningful accountability. This dynamic is particularly concerning for families and seniors, who may feel less secure in public spaces and parking lots after dark.
Neighborhood-level variation in Lynnwood is notable, with areas east of I-5, such as the neighborhoods near Meadowdale High School and Scriber Lake Park, generally experiencing lower crime rates than the western corridor along Highway 99, where motels, apartment complexes, and transient populations concentrate. Gated communities and newer developments in the northern part of the city report fewer incidents, while older residential zones near the city center see moderate property crime. Prospective renters and buyers are advised to examine block-level crime maps and consult local police precincts for specific street-level data, as safety can shift dramatically within a half-mile radius.
* Values derived from national, state, county, city and local statistics and may differ in a specific area. Last updated: 2026-04-21T11:13:09.000Z
Narrative content on this page is AI-generated and may contain mistakes. Verify any details that matter before acting on them.
ReloMaps may earn a commission from affiliate links at no extra cost to you.