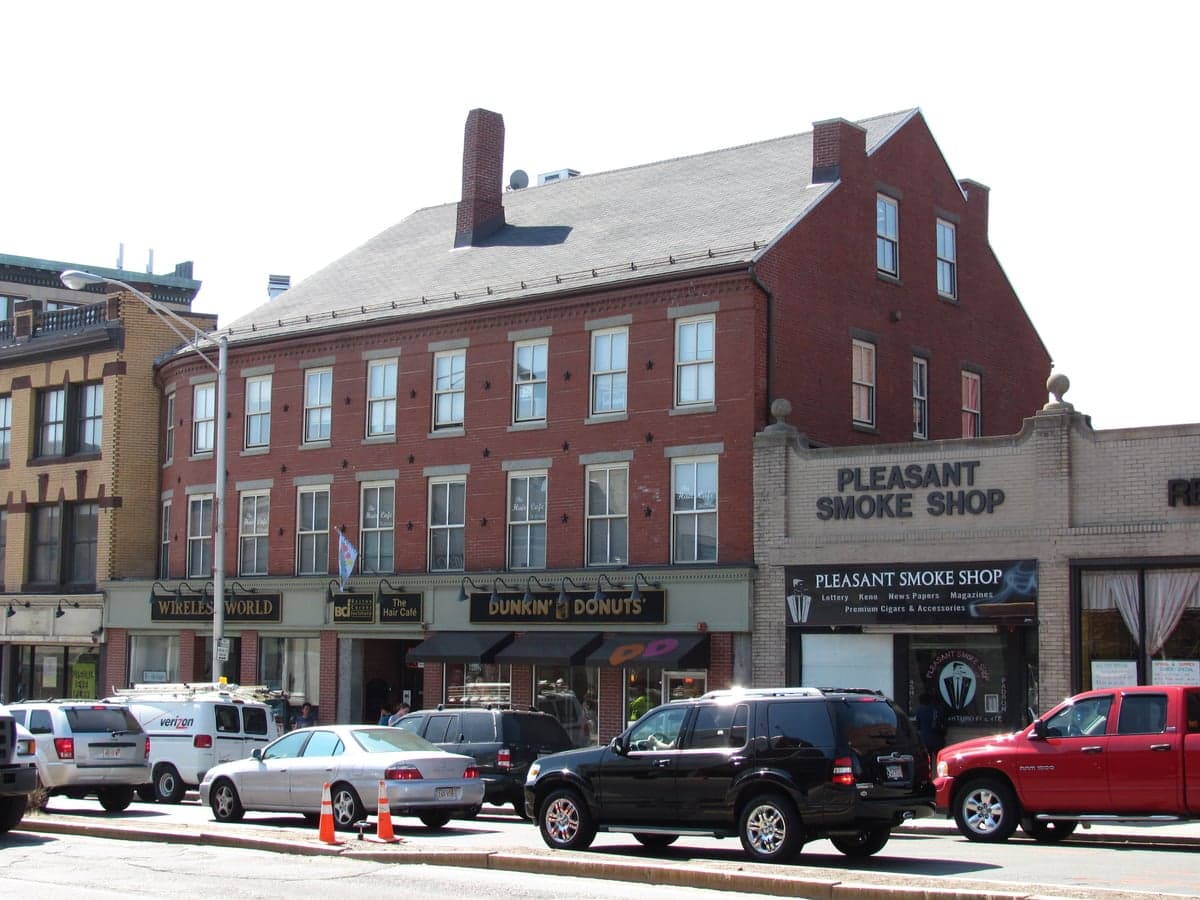


Photo: Wikipedia
Quality of Life in Malden, MA
Above-average quality of iife. The area offers a reasonable cost of living, decent mobility, and a mix of neighborhood amenities.
What does Quality of Life tell us?
Quality of Life blends cost of living, nearby amenities, socioeconomic signals, and neighborhood character. City-level scores represent the whole municipality; individual neighborhoods can differ.
What does this tell us?
Quality of Life blends cost of living, nearby amenities, socioeconomic signals, and neighborhood character. City-level scores represent the whole municipality; individual neighborhoods can differ.
Cost of Living
93% above national average
The Real Cost of Living in Malden, MA for 2026
| Tier | Individual | Family (4) |
|---|---|---|
| Survival | $33k | $62k |
| Comfortable | $103k | $152k |
| Luxury | $151k+ | $235k+ |
| Elite (Top 5%) | $178k+ | $276k+ |
63%
The Area Signal
A metric tracking the socioeconomic signals of the area.
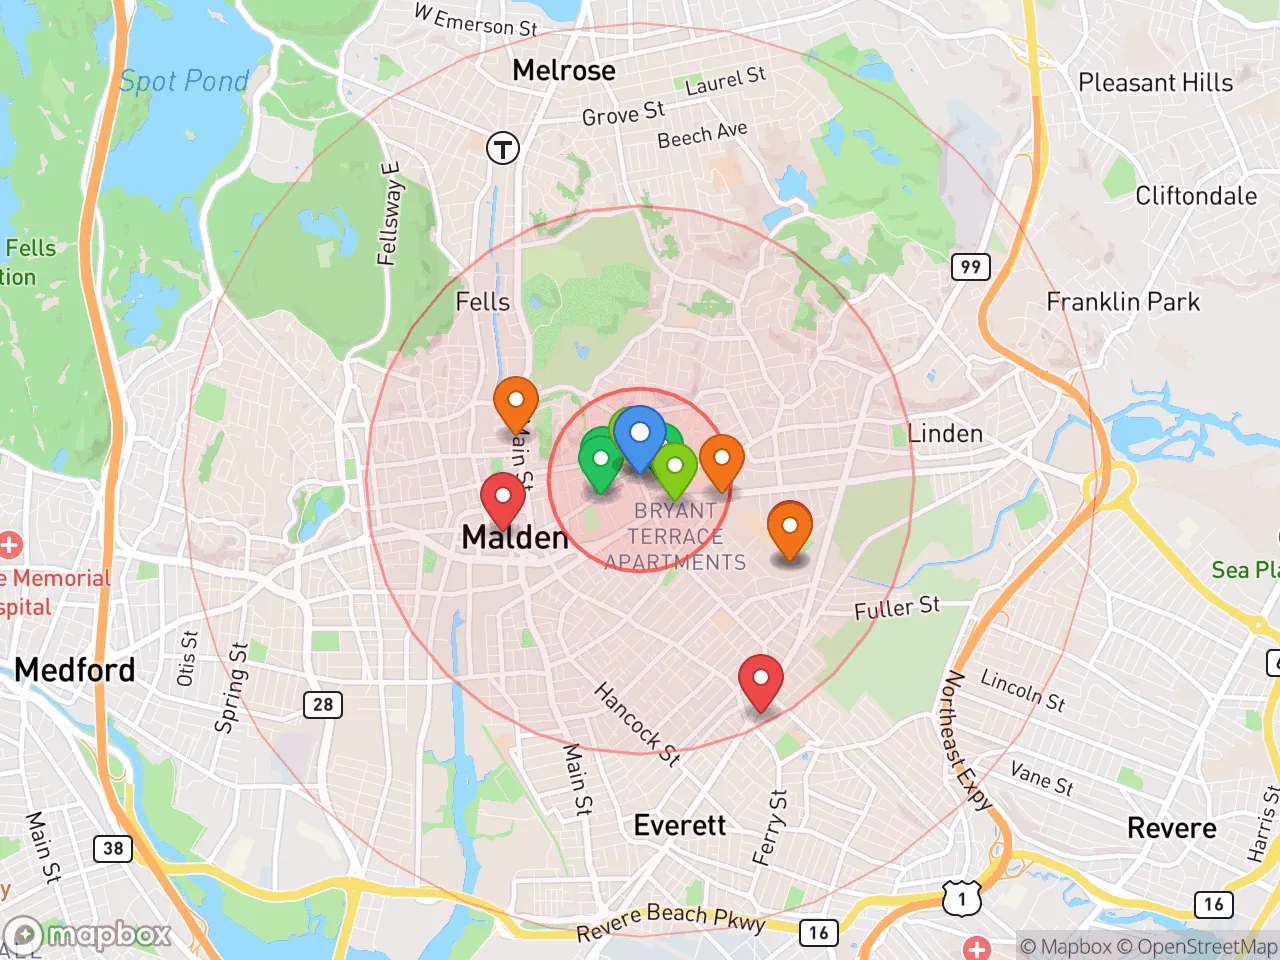
Hobbies
Explore the areaGroceries
7 within 10 miles
Gas
20 within 10 miles
Hospital
20 within 20 miles
Airport
PDX — Portland International Jetport
Post Office
USPS — Malden, MA
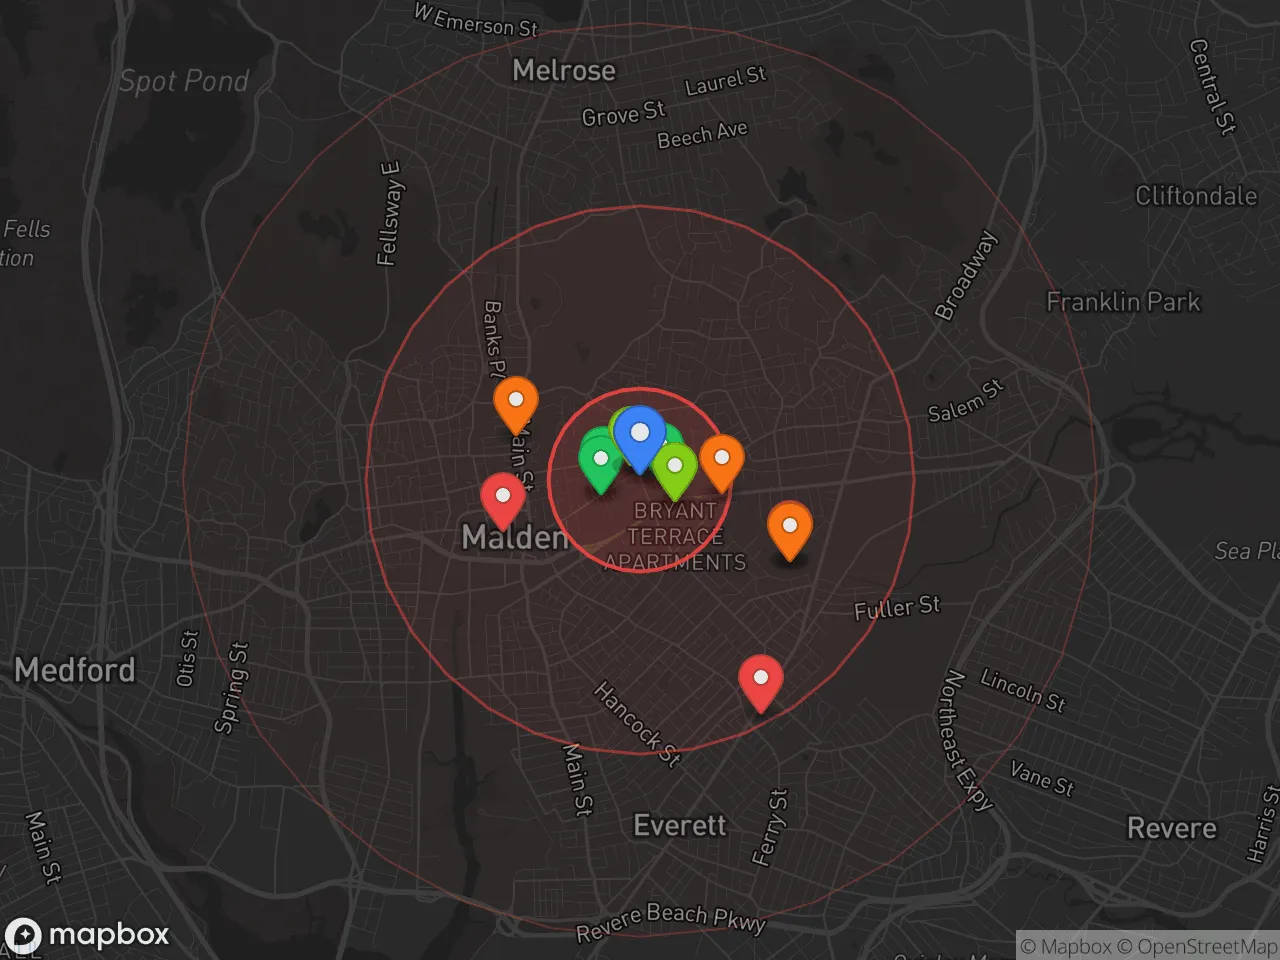
Critical Amenities
Quality-of-Life Analysis
Malden, Massachusetts, presents a classic Boston-adjacent trade-off: residents pay a cost of living index of 193—nearly double the U.S. average—in exchange for a dense, walkable urban-suburban blend that attracts a mix of young professionals, immigrant families, and long-term locals. The city’s population of roughly 60,000 is notably diverse, with significant Asian and Hispanic communities, and its median household income of about $75,000 reflects a middle-to-upper-middle-class demographic that values proximity to Boston without the premium of living inside the city limits.
Cost of living, housing, and affordability compared to Boston and Somerville
Malden’s cost of living index of 193 is steep by national standards, but it undercuts neighboring Boston (index ~220) and Somerville (~210) by a meaningful margin. The median home value sits at $607,500, roughly $150,000 less than the Boston metro median, while the median rent of $2,066 is about $400 cheaper than comparable units in Cambridge. For buyers, this means a three-bedroom single-family in the Oak Grove or Maplewood neighborhoods can still be found in the $550,000–$650,000 range—a relative bargain for the region. Renters face a tight market, however, with vacancy rates below 3% and many units requiring income verification at 3x rent. Property taxes in Malden run about $5,200 annually on the median home, which is moderate for Massachusetts. The affordability gap with Boston is narrowing as Malden’s Orange Line connection draws more commuters, pushing prices up roughly 8% year-over-year since 2022.
Amenities, schools, and what daily life is like for families and commuters
Daily life in Malden centers on its walkable downtown, anchored by the Malden Center MBTA station (Orange Line) and a growing roster of independent restaurants, breweries, and shops along Pleasant Street. The average commute time of 35.7 minutes is slightly above the national average but typical for the metro area; the Orange Line gets riders to Downtown Crossing in about 20 minutes, while drivers face I-93 congestion that can push the trip to 45 minutes during peak hours. For families, the Malden Public Schools system serves roughly 6,500 students and includes the well-regraded Malden High School, which offers an International Baccalaureate program. Parks like Fellsmere Park and Pine Banks Park provide green space for recreation, while the nearby Middlesex Fells Reservation offers hiking and mountain biking. The city lacks a major hospital within its borders, but Tufts Medical Center and Mass General are a short train ride away. Grocery access is solid, with a Market Basket and Stop & Shop in town, and the Malden Farmers Market runs June through October.
Malden is best suited for professionals and families who prioritize a short, transit-accessible commute to Boston over suburban sprawl, and who are comfortable with a higher cost of living in exchange for urban amenities and cultural diversity. It works well for first-time homebuyers priced out of Somerville or Cambridge, renters who want a neighborhood feel with city access, and immigrant families drawn to established communities and good schools. Those seeking large lots, quiet streets, or a low tax burden will find Malden too dense and expensive; instead, look north to Melrose or Wakefield for more space at a similar price point. For anyone who values walkability, transit, and a genuinely mixed-income environment, Malden delivers a rare combination in Greater Boston.
Crime in Malden, MA
Lower crime rates than 75% of comparable U.S. locations.
Violent CrimeViolent Crime Analysis
Property CrimeProperty Crime Analysis
Crime Analysis
Malden, Massachusetts, reports a violent crime rate of 186 incidents per 100,000 residents and a property crime rate of 1,121.8 per 100,000, placing it in a middle tier for safety among Boston-area suburbs. While these figures are below national averages for property crime, the city's proximity to Boston and its status as a dense, transit-connected urban center mean that crime patterns are influenced by regional dynamics, including the policies of the broader Middlesex County justice system. Residents should weigh these statistics against the reality that progressive prosecutorial approaches in the metro area can affect recidivism and street-level crime.
Crime in context
Malden's violent crime rate of 186 per 100K is roughly half the national average of 380 per 100K, but it is notably higher than the Massachusetts state average of approximately 135 per 100K. Property crime in Malden, at 1,121.8 per 100K, sits below the national average of 1,954 per 100K but above the state average of roughly 900 per 100K. The city's crime index is comparable to neighboring communities like Medford and Everett, though it is safer than downtown Boston. A key concern for residents is the influence of the Middlesex County District Attorney's office, which has adopted progressive policies—such as diversion programs and reduced bail recommendations—that critics argue can lead to quicker release of repeat offenders, potentially increasing property crime and nuisance offenses in transit-accessible areas like Malden Center.
What residents experience
Day-to-day safety in Malden varies significantly by neighborhood and time of day. The most common crimes reported are larceny, motor vehicle theft, and vandalism, with property crimes accounting for roughly 86% of all reported incidents. Violent crime is less frequent but tends to cluster around the Malden Center MBTA station and commercial corridors like Main Street and Ferry Street, where late-night activity and drug-related incidents occur. Residents in the Oak Grove and Maplewood areas generally report feeling safer, with lower incident densities. The city's police department has increased community patrols and installed cameras in high-traffic zones, but the broader challenge remains the regional justice system's emphasis on rehabilitation over incarceration, which can result in individuals arrested for theft or drug possession cycling back onto the streets quickly.
Neighborhood-level variation is pronounced. The area around the Malden Center transit hub sees higher rates of both property and violent crime due to foot traffic and easy access to Boston. In contrast, the residential neighborhoods west of Route 99 and near the Fellsmere Park area experience significantly fewer incidents, with violent crime rates dropping below 100 per 100K in some census tracts. Prospective renters and buyers should examine block-level crime maps and consider that proximity to the Orange Line station correlates with a 20-30% higher property crime rate compared to the city's quieter residential pockets. Overall, Malden offers a moderate safety profile for a Boston suburb, but the progressive justice policies in the region mean that residents should remain vigilant about property security and situational awareness, especially in transit-adjacent zones.
* Values derived from national, state, county, city and local statistics and may differ in a specific area. Last updated: 2026-05-01T07:46:35.000Z
Narrative content on this page is AI-generated and may contain mistakes. Verify any details that matter before acting on them.
ReloMaps may earn a commission from affiliate links at no extra cost to you.