Photo: Wikipedia
Demographics of Medford, MA
Affluence Level in Medford, MA
An upper-middle-class area. Household wealth, education levels, and homeownership run ahead of national benchmarks.
People of Medford, MA
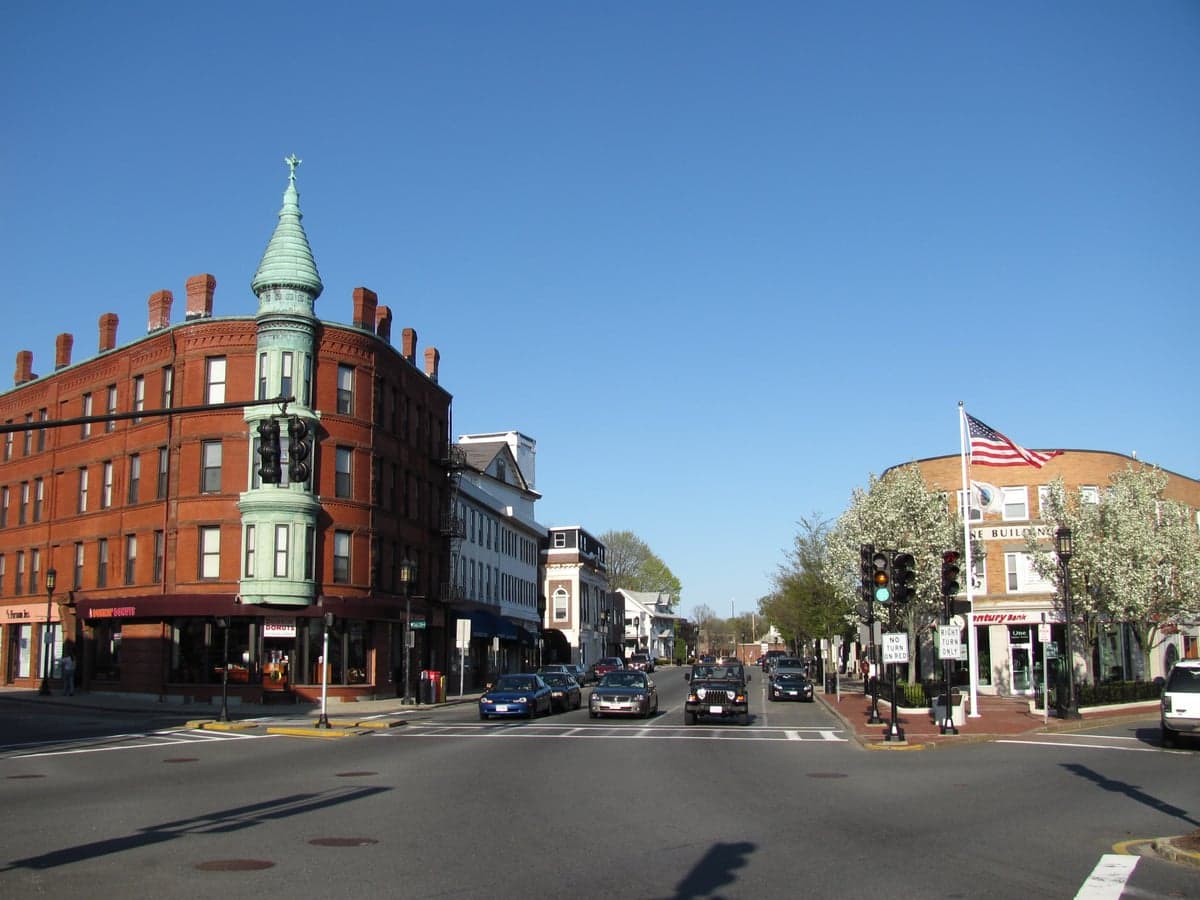
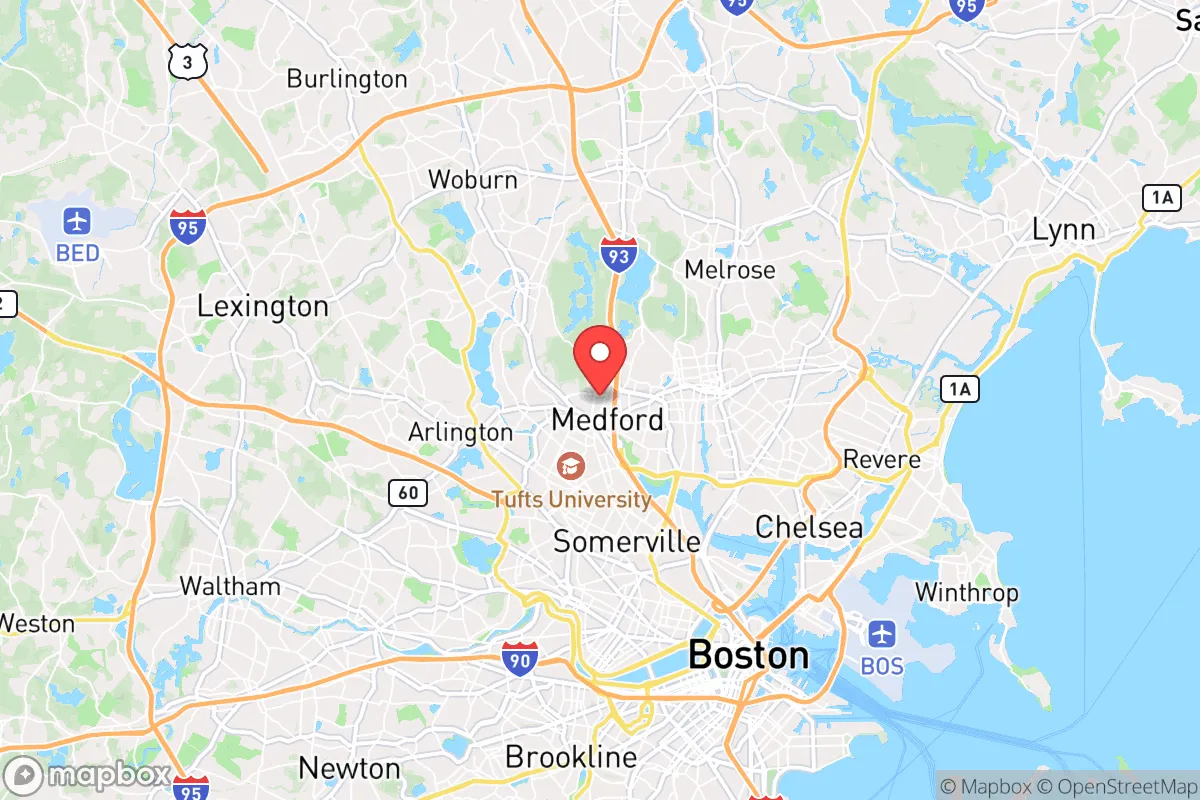
Medford, Massachusetts, is a dense, historic city of 59,062 residents that blends old-stock Yankee roots with a modern, highly educated professional class. With 57.6% of adults holding a college degree, the population is notably white-collar, yet the city retains a strong multi-ethnic character shaped by over a century of immigration. Today, Medford is a majority-white city (66.9%) with significant and distinct minority communities: East/Southeast Asian (8.0%), Hispanic (8.9%), Black (6.3%), and Indian-subcontinent (4.0%), alongside a foreign-born share of 11.2%.
How the city was settled and grew
Medford’s original European settlers were English Puritans who arrived in the 1630s, drawn by the Mystic River’s water power and fertile meadows. The city’s first industry was shipbuilding, which boomed along the riverfront in the 18th and early 19th centuries, attracting skilled English and Scottish craftsmen who settled in the Mystic River neighborhood around the shipyards. By the mid-1800s, Medford became a major rum-distilling and brick-making center, drawing a wave of Irish immigrants fleeing the Great Famine. These Irish laborers built St. Joseph’s Church and established a dense working-class enclave in South Medford, near the brick yards and factories. A second major wave came from Italian immigrants between 1890 and 1920, who worked in the city’s ice-harvesting and construction trades, concentrating in the Wellington and Glenwood neighborhoods. A smaller but notable community of Jewish immigrants from Eastern Europe settled in the West Medford area around the same period, establishing synagogues and small businesses along Main Street. By 1950, Medford was a classic ethnic-white, Catholic-majority city, with Irish and Italian surnames dominating the voter rolls.
Modern era (post-1965)
The 1965 Hart-Cellar Act reshaped Medford’s demographics, though the shift was gradual. The first post-1965 arrivals were East/Southeast Asian immigrants—primarily Chinese and Vietnamese—who began moving into the Wellington and South Medford neighborhoods in the 1980s, drawn by affordable multi-family homes and proximity to Boston’s Chinatown. Today, East/Southeast Asians make up 8.0% of the population, with a visible cluster of Vietnamese-owned restaurants and markets along Salem Street. A more recent and rapid wave has been Indian-subcontinent immigrants (4.0% of the population), largely professionals in tech and healthcare who began arriving in the 2000s. They have concentrated in the West Medford and Lawrence Estates areas, drawn by the highly rated Brooks Elementary School and easy commutes to Cambridge and Route 128 tech corridors. The Hispanic population (8.9%) is more dispersed but has a notable presence in South Medford, where a mix of Puerto Rican, Dominican, and Central American families have settled since the 1990s. The Black population (6.3%) is largely African American and Afro-Caribbean, with a concentration in the Wellington area near the Malden border. Meanwhile, the white population has aged and declined in share from roughly 90% in 1980 to 66.9% today, though many Irish and Italian families remain in the Glenwood and Mystic River neighborhoods.
The future
Medford’s population is trending toward greater diversity, but not toward homogenization. The Indian-subcontinent community is the fastest-growing segment, projected to rise from 4.0% to perhaps 6-7% by 2035, driven by continued tech-sector hiring and chain migration. East/Southeast Asian growth appears to be plateauing, as many second-generation families move to suburbs like Lexington or Acton. The Hispanic and Black shares are growing slowly but steadily, largely through natural increase rather than new immigration. The white population is declining in absolute numbers, but remains the majority and is increasingly concentrated among older homeowners in Glenwood and West Medford. The city is not tribalizing into hostile enclaves, but distinct ethnic neighborhoods persist: South Medford remains the most mixed and working-class, West Medford is becoming a professional-class Indian and white enclave, and Wellington retains a blue-collar, multi-ethnic character. Over the next decade, expect Medford to become slightly more Asian (East and South combined) and slightly less white, while remaining a stable, middle-to-upper-middle-income city.
For a conservative-leaning mover, Medford offers a dense, walkable, historically rooted community that is diversifying without losing its character. The city is not a transient bedroom suburb—it has deep neighborhood identities, strong Catholic and Jewish institutional presences, and a population that values local schools and public safety. The main demographic risk is the continued aging of the white homeowner base, which could lead to a gradual shift in political and cultural norms, but for now, Medford remains a stable, family-oriented city with a clear sense of its past.
* Values derived from national, state, county, city and local statistics and may differ in a specific area. Last updated: 2026-05-01T06:30:28.000Z
Narrative content on this page is AI-generated and may contain mistakes. Verify any details that matter before acting on them.
ReloMaps may earn a commission from affiliate links at no extra cost to you.