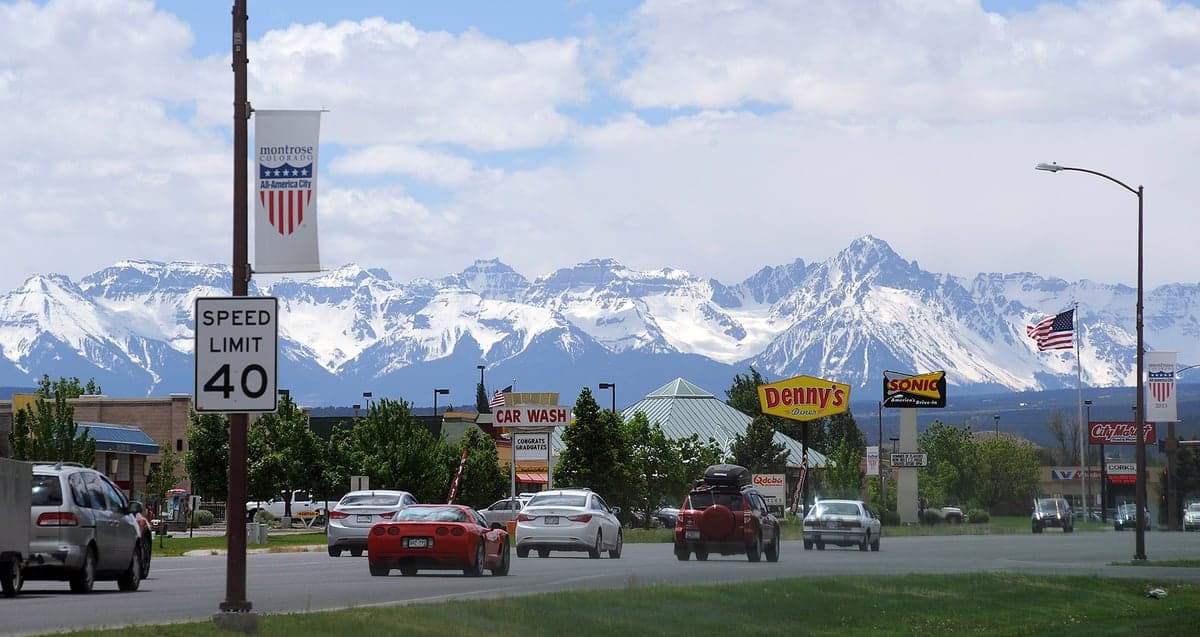
Photo: Wikipedia
Demographics of Montrose, CO
Affluence Level in Montrose, CO
A middle-class area roughly in line with national averages across income, home values, education, and employment.
People of Montrose, CO
The people of Montrose, Colorado today number 20,703, forming a predominantly White (75.0%) and Hispanic (20.7%) community with a notably low foreign-born share of just 4.2%. The city’s character is shaped by its role as a regional trade and healthcare hub for western Colorado’s ranching and energy sectors, giving it a practical, family-oriented identity distinct from the resort-driven economies of Aspen or Telluride. With 33.6% of adults holding a college degree—slightly below the national average—Montrose attracts residents seeking a lower cost of living, outdoor access, and a slower pace, rather than high-tech or academic careers. The population is overwhelmingly native-born, with small but visible East/Southeast Asian (0.7%), Indian subcontinent (0.3%), and Black (0.2%) communities concentrated in specific neighborhoods.
How the city was settled and grew
Montrose was founded in 1882 as a railroad town on the Denver & Rio Grande Western line, with the original population drawn by land grants under the Homestead Act and the promise of irrigated farming along the Uncompahgre River. The earliest settlers were predominantly Anglo-American homesteaders from the Midwest and Great Plains, who established the Downtown Historic District around Main Street as the commercial and civic core. By the early 1900s, a wave of Hispanic families arrived, many tracing their roots to Spanish colonial settlements in New Mexico and southern Colorado; they built the South Montrose neighborhood south of the railroad tracks, where adobe-style homes and the Our Lady of Guadalupe Catholic Church (established 1914) anchored the community. A smaller group of Italian and Slavic immigrants came to work in the coal mines of the surrounding North Fork Valley, settling in the North Montrose area near the former rail yards. The city’s growth remained modest through the mid-20th century, with the population reaching roughly 5,000 by 1950, driven by agriculture (fruit orchards, alfalfa, livestock) and the nearby U.S. Army’s Camp Hale (World War II) and later the Bureau of Reclamation’s projects on the Gunnison River.
Modern era (post-1965)
After the 1965 Hart-Cellar Act, Montrose saw minimal direct immigration—unlike Colorado’s Front Range—but experienced steady domestic in-migration from retirees, outdoor enthusiasts, and families fleeing higher-cost states like California and Texas. The Hispanic community grew primarily through natural increase and internal migration from other parts of Colorado and New Mexico, rather than new foreign arrivals, with the Hispanic share rising from roughly 12% in 1980 to 20.7% today. This growth concentrated in South Montrose and the newer Sunset Mesa subdivision (developed in the 1990s and 2000s), where many Hispanic families purchased single-family homes. The small East/Southeast Asian population (0.7%) is largely composed of Filipino and Vietnamese families who arrived in the 1980s and 1990s, often connected to the Montrose Regional Health system or the U.S. Bureau of Land Management offices; they are clustered in the West Park neighborhood near the hospital. The Indian subcontinent community (0.3%) is even smaller, primarily professionals in healthcare and engineering who settled in the newer Larkspur subdivision east of town. The Black population (0.2%) remains tiny and dispersed, with no distinct neighborhood concentration. Suburbanization since the 1990s has pushed growth into North Montrose and the Riverbottom area along Highway 50, where large-lot subdivisions attract White families moving from rural Colorado and out-of-state retirees.
The future
Montrose’s population is projected to grow modestly—perhaps 1–2% annually—driven by domestic migration from higher-cost Western states, not international immigration. The Hispanic share is likely to continue rising slowly through natural increase, potentially reaching 25–28% by 2040, but the city is not tribalizing into distinct ethnic enclaves; instead, Hispanic families are increasingly moving into previously White-dominated subdivisions like Sunset Mesa and Larkspur, indicating assimilation. The foreign-born share (4.2%) is unlikely to rise significantly given the city’s lack of major immigrant-employing industries (no meatpacking, no large-scale agriculture, no tech sector). The East/Southeast Asian and Indian communities will likely remain small and professional, concentrated in healthcare and engineering roles. The White population, while still the majority, is aging—Montrose’s median age is 40.6—and younger White families are being drawn to newer developments in Riverbottom and North Montrose, where schools like Montrose High School and the new Johnson Elementary serve a growing student body.
For someone moving in now, Montrose is becoming a more diverse but still predominantly White and Hispanic community, with a stable, family-oriented character and little of the rapid demographic churn seen in Colorado’s Front Range. The city offers a predictable, low-immigration environment where the main population story is domestic in-migration from other Western states, not international change. New arrivals will find a place where neighborhoods remain broadly integrated by income and ethnicity, with no strong enclaves—a practical, middle-American feel in a high-desert setting.
* Values derived from national, state, county, city and local statistics and may differ in a specific area. Last updated: 2026-05-01T10:32:10.000Z
Narrative content on this page is AI-generated and may contain mistakes. Verify any details that matter before acting on them.
ReloMaps may earn a commission from affiliate links at no extra cost to you.