Photo: Wikipedia
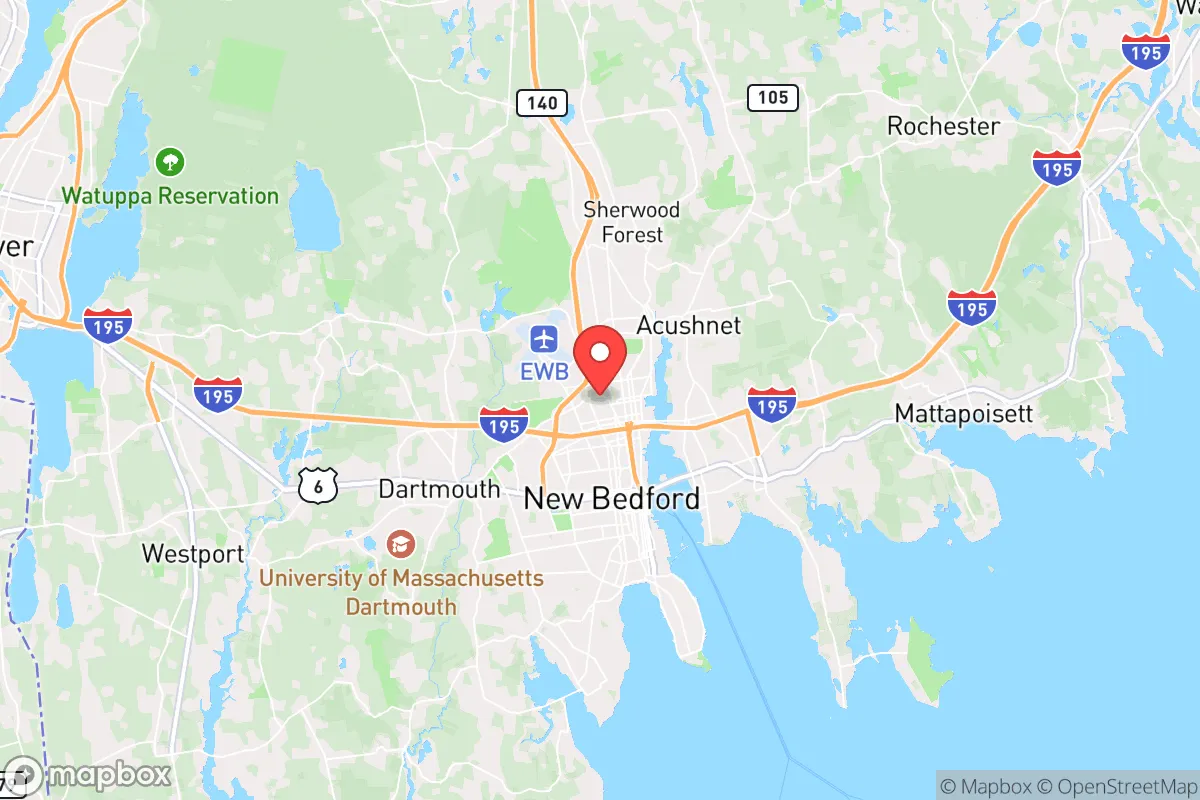
Demographics of New Bedford, MA
Affluence Level in New Bedford, MA
A below-average socioeconomic profile. Incomes, home values, and educational attainment trail the U.S., with higher poverty and unemployment.
People of New Bedford, MA
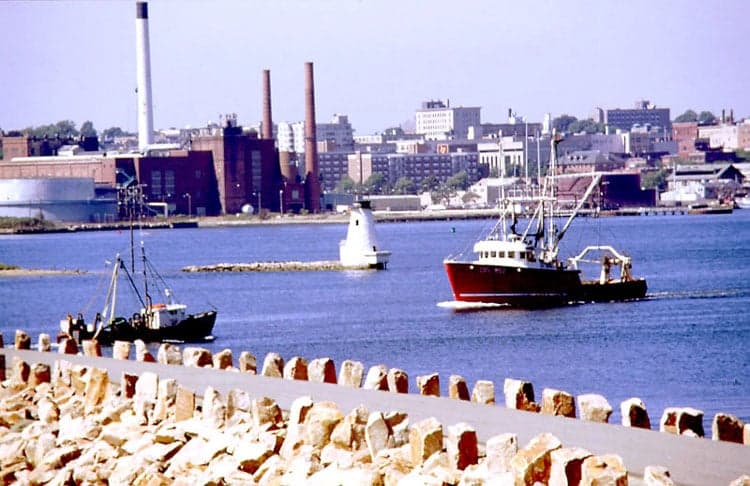
New Bedford, Massachusetts, is a city of 100,731 residents defined by its deep Portuguese and Azorean heritage, a growing Hispanic population, and a working-class character that resists gentrification. It is one of the most densely populated cities in the state, with a distinct identity shaped by its historic role as the world’s 19th-century whaling capital and its later transformation into a fishing and manufacturing hub. The city today is majority-minority, with a white population of 55.6%, a Hispanic population of 24.5%, and a Black population of 5.3%, while foreign-born residents make up 10.9% of the total. Its low college attainment rate of 16.8% reflects a workforce historically tied to blue-collar industries rather than the knowledge economy.
How the city was settled and grew
New Bedford’s population story begins with its founding in the 1760s as a Quaker whaling port, drawing English settlers from nearby Plymouth and Rhode Island. The whaling boom of the 1800s brought a wave of migrants from the Azores and Cape Verde — Portuguese-speaking islanders who arrived as crewmen and later settled in the South End and Clark’s Point neighborhoods, building the city’s enduring Portuguese Catholic identity. By the 1850s, Irish immigrants fleeing the famine also arrived, establishing themselves in the North End around the mills and docks. The late 19th century saw French-Canadian and Polish workers come for the textile mills, clustering in the West End and Acushnet Avenue corridor. These groups formed distinct ethnic parishes and social clubs that persisted for generations, creating a patchwork of neighborhoods where language and tradition remained strong into the mid-20th century.
Modern era (post-1965)
The 1965 Hart-Cellar Act reshaped New Bedford’s demographics by opening immigration from Latin America and Asia, while the collapse of the textile industry in the 1970s triggered white flight to surrounding suburbs like Fairhaven and Dartmouth. The most significant post-1965 shift has been the arrival of Hispanic immigrants, primarily from Puerto Rico and the Dominican Republic, who now make up nearly a quarter of the city’s population. They concentrated in the North End and along Acushnet Avenue, areas that had previously been Irish and Polish, creating a new cultural corridor of bodegas and Pentecostal churches. The Portuguese and Cape Verdean communities, while still the largest ethnic group, have aged and begun to suburbanize, with younger generations moving to Dartmouth and Fall River. The Asian population remains tiny at 0.8% (East/Southeast Asian) and the Indian-subcontinent population at 0.7%, mostly professionals drawn to the region’s hospitals and universities but not forming a visible enclave. The Black population, at 5.3%, is largely native-born and concentrated in the South End near the waterfront, a legacy of Cape Verdean settlement that predates the modern era.
The future
New Bedford’s population is trending toward a tripartite division: an aging white and Portuguese cohort in the West End and South End, a growing Hispanic majority in the North End, and a small but stable Black and Cape Verdean presence near the harbor. The Hispanic share is likely to continue rising, driven by higher birth rates and continued migration from Puerto Rico and Central America, potentially reaching 30-35% within a decade. The Portuguese community, by contrast, is plateauing as immigration from the Azores has slowed to a trickle and younger generations leave for cheaper housing inland. The city is not homogenizing — rather, it is tribalizing into distinct ethnic enclaves with limited cross-neighborhood mixing, a pattern reinforced by the city’s weak public schools and lack of a unifying downtown. For a conservative-leaning newcomer, this means choosing a neighborhood matters: the West End offers older, quieter streets with a higher share of owner-occupied homes and a more traditional New England feel, while the North End is younger, more transient, and more heavily rental.
New Bedford is becoming a majority-Hispanic, working-class city with a Portuguese cultural backbone that is slowly fading. For someone moving in now, the city offers affordability and a strong sense of place, but also persistent poverty, low educational attainment, and a demographic trajectory that favors immigrant communities over native-born whites. The key decision is whether to settle in the stable, older neighborhoods like the West End or the more dynamic but less settled areas like Acushnet Avenue — each offers a different version of what this city is becoming.
* Values derived from national, state, county, city and local statistics and may differ in a specific area. Last updated: 2026-04-23T05:00:12.000Z
Narrative content on this page is AI-generated and may contain mistakes. Verify any details that matter before acting on them.
ReloMaps may earn a commission from affiliate links at no extra cost to you.