

Photo: Wikipedia
Quality of Life in New Bedford, MA
Above-average quality of iife. The area offers a reasonable cost of living, decent mobility, and a mix of neighborhood amenities.
What does Quality of Life tell us?
Quality of Life blends cost of living, nearby amenities, socioeconomic signals, and neighborhood character. City-level scores represent the whole municipality; individual neighborhoods can differ.
What does this tell us?
Quality of Life blends cost of living, nearby amenities, socioeconomic signals, and neighborhood character. City-level scores represent the whole municipality; individual neighborhoods can differ.
Cost of Living
2% above national average
The Real Cost of Living in New Bedford, MA for 2026
| Tier | Individual | Family (4) |
|---|---|---|
| Survival | $17k | $33k |
| Comfortable | $63k | $93k |
| Luxury | $96k+ | $149k+ |
| Elite (Top 5%) | $113k+ | $175k+ |
60%
The Area Signal
A metric tracking the socioeconomic signals of the area.
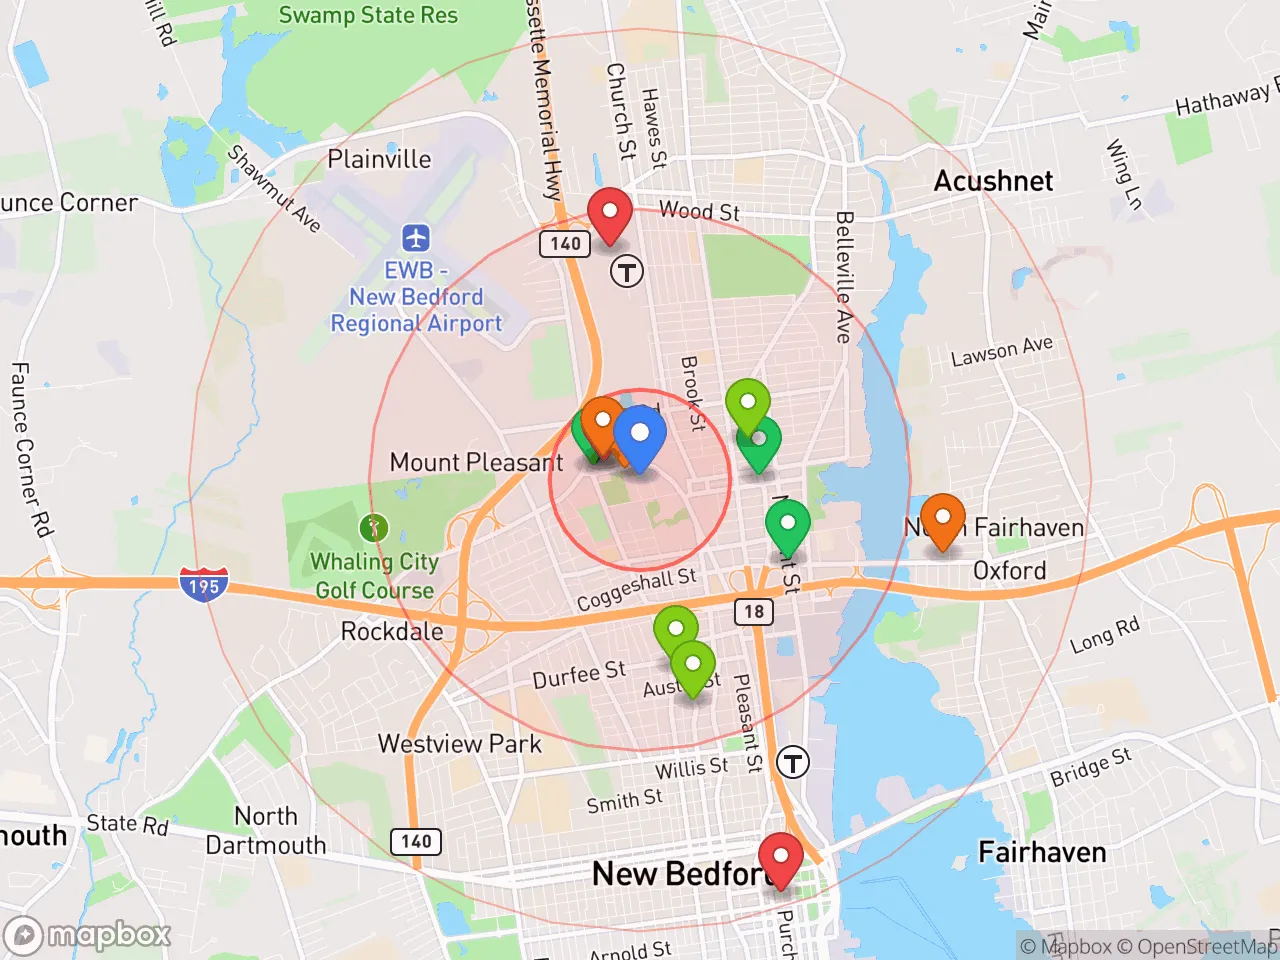
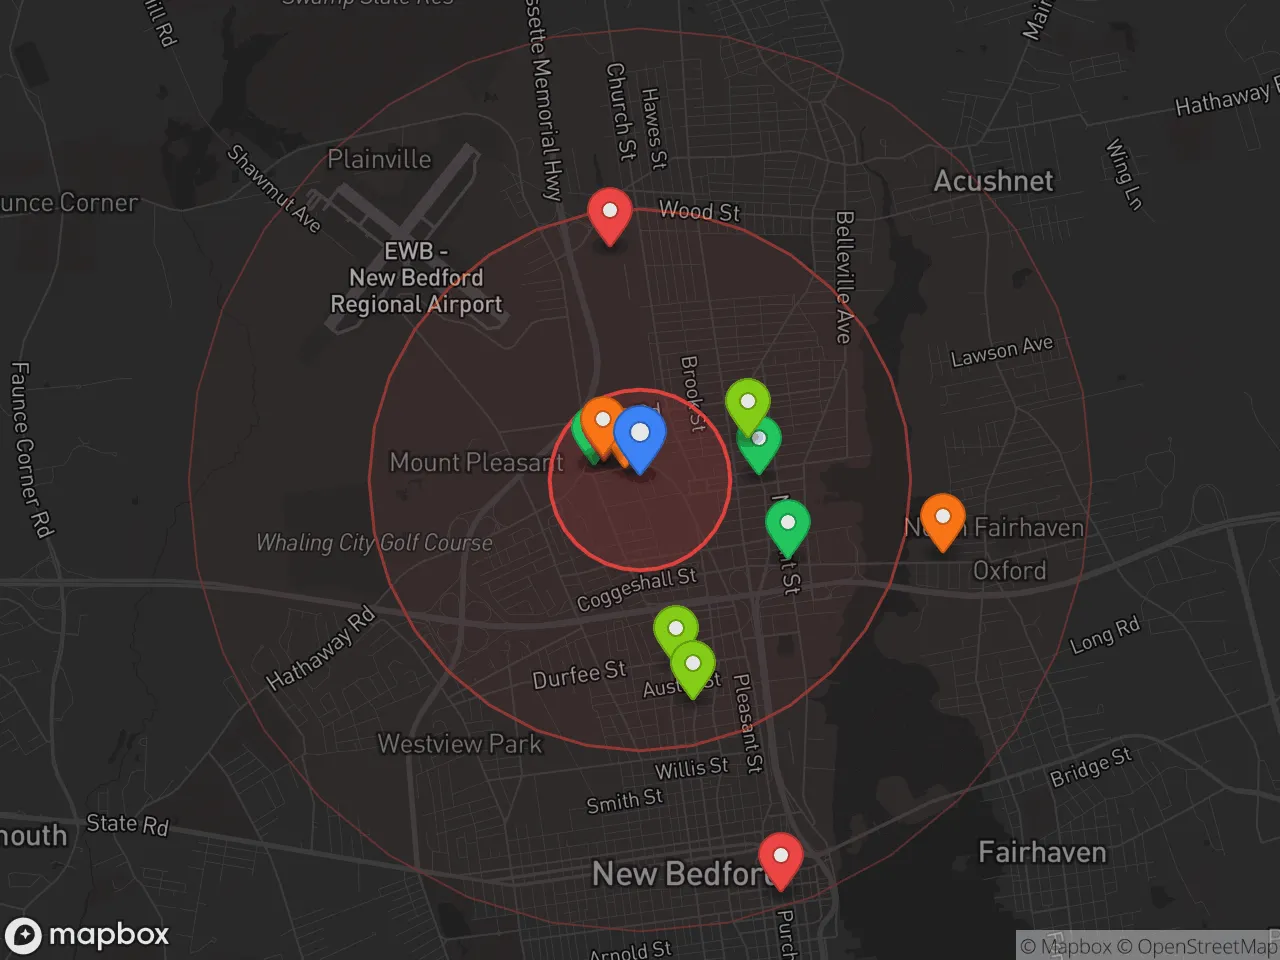
Hobbies
Explore the areaGroceries
7 within 10 miles
Gas
20 within 10 miles
Hospital
14 within 20 miles
Airport
PDX — Portland International Jetport
Post Office
USPS — New Bedford, MA
Critical Amenities
Quality-of-Life Analysis
New Bedford, Massachusetts, offers a quality of life that blends historic coastal character with working-class affordability, attracting a mix of longtime fishing families, first-time homebuyers priced out of Boston, and artists drawn to its revitalized downtown. The city's cost of living index sits at 102 (just 2% above the national average), making it a relative bargain compared to the rest of eastern Massachusetts, where many communities index well above 130. Residents tend to be a pragmatic, community-oriented group — roughly 65% of households earn between $35,000 and $100,000 annually — and the population includes a significant Portuguese-American and Cape Verdean diaspora that shapes the local food, festivals, and daily rhythm.
How housing costs and daily expenses compare to nearby areas
New Bedford's housing market is the primary draw for budget-conscious movers. The median home value is $324,400, roughly half the Massachusetts state median of $600,000 and less than a third of the Boston metro median. Median rent is $1,085, which undercuts nearby Fall River ($1,250) and Providence, RI ($1,450) by a wide margin. A typical two-bedroom apartment in the historic South End or near the waterfront runs $1,000–$1,200, while a comparable unit in suburban Dartmouth or Fairhaven costs $1,400–$1,600. The trade-off is an older housing stock — many triple-deckers and 19th-century mill buildings — so buyers should budget for deferred maintenance. Utilities run about 10% higher than the national average due to New England's heating costs, but groceries and healthcare are near the U.S. baseline. The average commute of 25.2 minutes is shorter than the state average of 30 minutes, with most workers heading to local healthcare employers (Southcoast Health, St. Luke's Hospital) or manufacturing/logistics firms along the I-195 corridor.
What daily life is like for families, commuters, and culture seekers
Daily life in New Bedford centers on a walkable downtown that has seen a decade-long cultural revival. The New Bedford Whaling National Historical Park anchors a district of galleries, seafood restaurants, and the acclaimed New Bedford Art Museum. The public school system includes 23 elementary and secondary schools, with the high school offering a well-regarded marine science and technology academy. For families, the city's 30+ parks and the Buttonwood Park Zoo provide low-cost recreation, while the working waterfront offers whale-watching tours and fresh-catch markets. Commuters benefit from the MBTA's commuter rail service to Boston (about 90 minutes) and a regional bus network, though most residents drive. The city's Portuguese and Cape Verdean heritage is visible in daily life — bakeries selling malasadas, annual festivals like the Feast of the Blessed Sacrament, and a strong community soccer culture. Nightlife is modest but growing, with craft breweries and live music venues replacing former mill spaces. The biggest daily friction points are parking (limited in the downtown core) and property taxes, which at $14.50 per $1,000 of assessed value are higher than the national norm but in line with Massachusetts coastal towns.
New Bedford is best suited for people who value authentic, unpolished urban character over suburban perfection. First-time homebuyers and renters seeking a lower cost of entry to the Massachusetts coast will find the most immediate benefit. Creative professionals and remote workers can take advantage of the city's fiber internet availability and relatively low overhead. Families should weigh the school system's mixed state rankings against the availability of specialized magnet programs and the safety of individual neighborhoods — the city's property crime rate is above the national average, but violent crime is concentrated in specific blocks. Retirees on fixed incomes may appreciate the walkable downtown and access to healthcare, though the hilly terrain and older housing can pose accessibility challenges. For anyone willing to trade glossy amenities for genuine community and a deep sense of place, New Bedford delivers a quality of life that feels both grounded and quietly ambitious.
Crime in New Bedford, MA
Crime rates similar to the national median for U.S. locations.
Violent CrimeViolent Crime Analysis
Property CrimeProperty Crime Analysis
Crime Analysis
New Bedford, Massachusetts, reports a violent crime rate of 235.8 incidents per 100,000 residents and a property crime rate of 813.5 per 100,000, placing it above both state and national averages for property offenses. While the city's violent crime rate is slightly below the national median, its property crime rate significantly exceeds the Massachusetts average of roughly 1,100 per 100,000, indicating a heightened risk for theft, burglary, and vehicle-related crimes. The overall safety picture is one of moderate concern, particularly for property-related incidents, with the city's status as a dense, post-industrial port community contributing to these figures.
Crime in context
New Bedford's violent crime rate of 235.8 per 100,000 is about 37% lower than the national average of roughly 380 per 100,000, but it remains elevated compared to the Massachusetts state average of approximately 300 per 100,000. Property crime, at 813.5 per 100,000, is roughly 30% higher than the national average of 1,954 per 100,000 and notably above the state's lower property crime baseline. The city's proximity to the Boston metropolitan area and its role as a regional economic hub mean that crime patterns are influenced by both local socioeconomic factors and broader urban dynamics. Readers should note that Massachusetts, particularly in Bristol County, has seen progressive district attorney policies that prioritize diversion and reduced incarceration for non-violent offenses, which can correlate with higher recidivism and property crime rates in practice, even as violent crime remains comparatively controlled.
What residents experience
Residents most frequently encounter property crimes such as motor vehicle theft, larceny, and burglary, which are concentrated in commercial corridors and densely populated neighborhoods. The city's historic downtown and areas near the waterfront, including the North End and South Central neighborhoods, report the highest incident densities. Violent crime, while less common, is often linked to domestic disputes and drug-related conflicts, with the city's homicide rate averaging 3-5 per year over the past decade. Daily life for most residents involves standard urban precautions: locking vehicles, avoiding isolated areas at night, and securing homes, particularly in rental-heavy districts. The presence of progressive judicial policies in the region—such as cash bail reform and reduced prosecution of low-level theft—has been cited by local law enforcement as a factor in repeat property offenses, though violent crime rates have remained relatively stable.
Neighborhood-level variation
Safety varies significantly across New Bedford's neighborhoods. The West End and Far North areas, including the neighborhoods of Ashley Heights and Pine Hill, generally report lower crime rates, with property crime incidents roughly half the city average. In contrast, the South End and areas around Route 18 and the New Bedford-Fairhaven Bridge see elevated theft and vandalism. The city's public housing developments, such as those on Ruth Street and in the Hicks-Logan area, experience higher concentrations of both property and violent crime. For those considering relocation, neighborhoods west of I-195 and north of Rockdale Avenue tend to offer the safest residential environments, while areas closer to the downtown commercial core require more vigilance. Overall, New Bedford's crime profile is typical of a mid-sized New England city with progressive justice policies, where property crime is the primary concern and violent crime remains below national averages.
* Values derived from national, state, county, city and local statistics and may differ in a specific area. Last updated: 2026-04-23T05:00:12.000Z
Narrative content on this page is AI-generated and may contain mistakes. Verify any details that matter before acting on them.
ReloMaps may earn a commission from affiliate links at no extra cost to you.