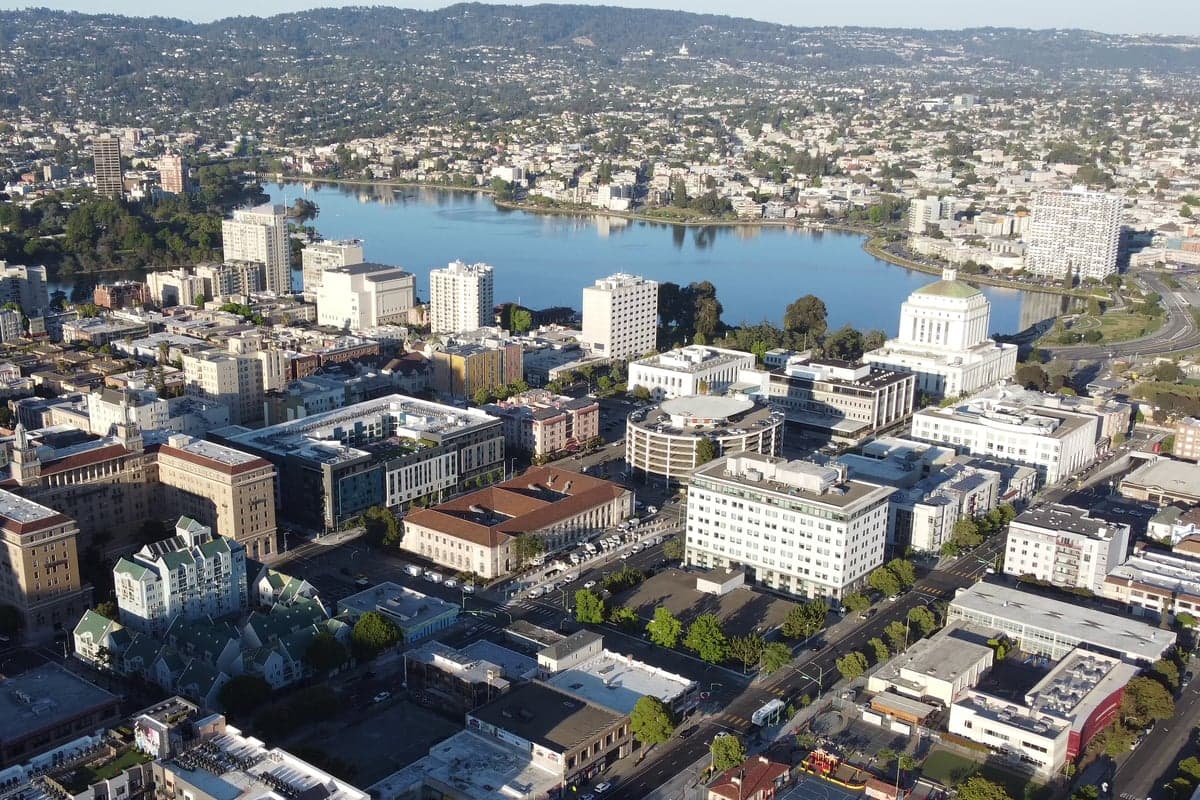
Photo: Wikipedia
Quality of Life in Oakland, CA
Above-average quality of iife. The area offers a reasonable cost of living, decent mobility, and a mix of neighborhood amenities.
What does Quality of Life tell us?
Quality of Life blends cost of living, nearby amenities, socioeconomic signals, and neighborhood character. City-level scores represent the whole municipality; individual neighborhoods can differ.
What does this tell us?
Quality of Life blends cost of living, nearby amenities, socioeconomic signals, and neighborhood character. City-level scores represent the whole municipality; individual neighborhoods can differ.
Cost of Living
130% above national average
The Real Cost of Living in Oakland, CA for 2026
| Tier | Individual | Family (4) |
|---|---|---|
| Survival | $31k | $58k |
| Comfortable | $146k | $215k |
| Luxury | $176k+ | $273k+ |
| Elite (Top 5%) | $252k+ | $390k+ |
45%
The Area Signal
A metric tracking the socioeconomic signals of the area.
Hobbies
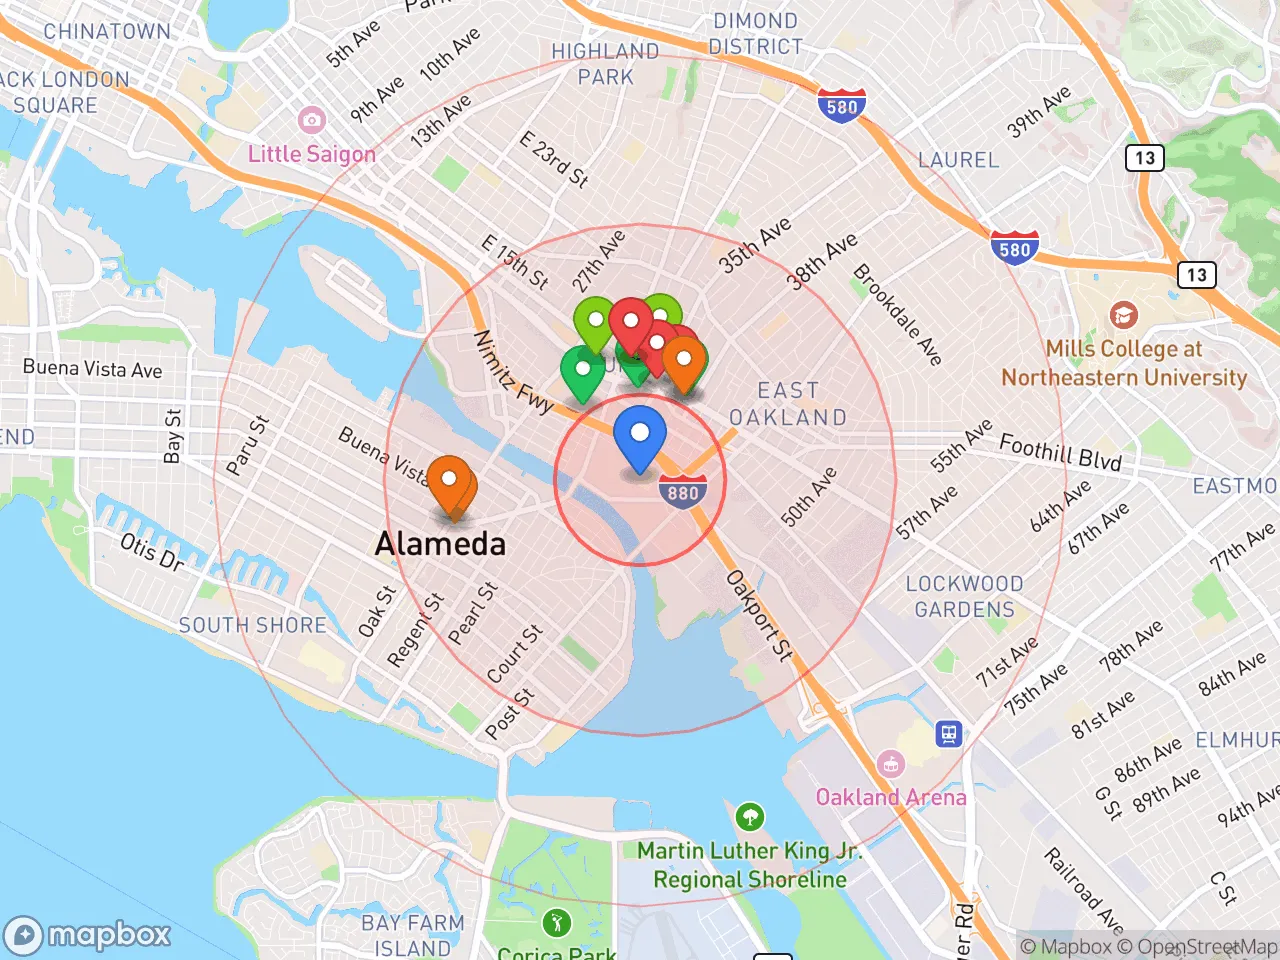
Explore the areaGroceries
5 within 10 miles
Gas
20 within 10 miles
Hospital
20 within 20 miles
Airport
SAN — Oakland San Francisco Bay
Post Office
USPS — Oakland, CA
Critical Amenities
Quality-of-Life Analysis
Oakland, California, presents a complex quality-of-life picture defined by its status as a major Bay Area hub with a cost of living index of 230 (more than double the U.S. average), a median home value of $924,700, and a median rent of $1,917. The city attracts a diverse mix of young professionals, longtime working-class families, artists, and tech workers priced out of San Francisco, creating a vibrant but economically stratified population. While Oakland offers cultural richness and proximity to San Francisco and Silicon Valley, its affordability challenges and daily realities differ sharply from its more expensive neighbors.
Cost of living, housing affordability, and how Oakland compares to San Francisco and Berkeley
Oakland’s cost of living is significantly lower than San Francisco’s (index ~269) but still far above the national baseline, making it a relative bargain within the Bay Area. The median home value of $924,700 is roughly 40% less than San Francisco’s median, yet still requires a household income well above $200,000 to afford comfortably. Median rent at $1,917 is notably lower than San Francisco’s typical $3,000+ for a one-bedroom, but this figure masks wide variation: rents in desirable neighborhoods like Rockridge or Temescal can exceed $2,500, while deeper East Oakland units may fall below $1,500. The average commute of 30.5 minutes is shorter than the Bay Area average of 34 minutes, thanks to Oakland’s central location and robust BART and ferry connections. However, housing costs still consume a disproportionate share of income for most renters, and homeownership remains out of reach for all but the highest earners.
Daily life, amenities, schools, and neighborhood rhythm for families and professionals
Daily life in Oakland is defined by its walkable, neighborhood-centric character, with distinct areas like the bustling Uptown arts district, the family-friendly Grand Lake area, and the culturally rich Fruitvale district. The city offers strong public amenities including the 500-acre Redwood Regional Park, Lake Merritt’s 3.4-mile walking loop, and a thriving food scene anchored by the Grand Lake Farmers Market and dozens of independent restaurants. Public schools are a mixed bag: Oakland Unified School District includes high-performing options like Oakland Technical High School and Hillcrest Elementary, but overall district performance lags behind suburban counterparts, prompting many families to consider charter or private schools. The rhythm of daily life is faster-paced than suburban Alameda or Piedmont, with more traffic, noise, and visible homelessness, but also more spontaneous cultural events, live music venues, and a strong sense of community activism. For professionals, the presence of major employers like Kaiser Permanente, Clorox, and Pandora provides stable local jobs, while remote workers benefit from Oakland’s relatively lower rents compared to San Francisco.
Oakland is best suited for individuals and families who value urban diversity, cultural vibrancy, and proximity to the broader Bay Area job market, and who can navigate a high cost of living without requiring top-tier public schools or a car-centric suburban lifestyle. Those who thrive here are typically comfortable with a gritty, real-city environment that offers authentic community connections, a strong food and arts scene, and access to nature—but who also have the financial flexibility to absorb housing costs that are among the highest in the nation. It is less ideal for budget-conscious families seeking affordable homeownership or for those who prioritize quiet, low-crime suburbs with uniformly excellent schools.
Crime in Oakland, CA
WARNING: The crime statistics are unreliable for this jurisdiction. Local authorities have either not reported or under reported their data to the FBI. This could be due to bad intentions, incompetence or technical issues. Regardless, we suggest skepticism.
Higher crime rates than 65% of comparable U.S. locations.
Violent CrimeViolent Crime Analysis
Property CrimeProperty Crime Analysis
Crime Analysis
Oakland, California, faces a serious public safety challenge, with violent and property crime rates that significantly exceed both state and national averages. The city's 2024 reported violent crime rate of 328.5 incidents per 100,000 residents is roughly double the national average, while its property crime rate of 1,394.1 per 100,000 is nearly three times the U.S. figure. These statistics reflect a broader crisis in the East Bay, where progressive criminal justice policies have contributed to a perception of lawlessness and a diminished quality of life for law-abiding residents.
Crime in context
Oakland's crime problem is not an anomaly but a consequence of deliberate policy choices. The city's violent crime rate is 85% higher than the California state average and more than double the national rate. Property crime is even more stark: Oakland's rate is 2.7 times the national average and 60% above the state average. These figures place Oakland among the most dangerous large cities in the United States. The root cause is a justice system that prioritizes offender rehabilitation over public safety. Progressive district attorneys and judges in Alameda County have implemented policies such as cash bail reform, reduced sentencing for repeat offenders, and early release programs. While intended to reduce incarceration, these measures have directly resulted in more criminals returning to the streets, emboldening property and violent offenders alike. The result is a city where car break-ins, robberies, and burglaries are routine, and violent confrontations are increasingly common.
What residents experience
For Oakland residents, the daily reality is one of heightened vigilance and frustration. Property crime is the most pervasive issue: car break-ins occur at a rate of over 50 per day, and retail theft has forced many businesses to close or relocate. Residents report that police response times are slow, and that 911 calls for non-life-threatening incidents often go unanswered for hours. The city's 2024 clearance rate for property crimes was below 10%, meaning the vast majority of offenders face no consequences. This impunity is a direct outcome of progressive policies that deprioritize prosecution for lower-level offenses. For victims, the impact is not just financial—it erodes trust in the justice system and creates a sense of abandonment. Violent crime, while less frequent, is more terrifying: homicides, though down from pandemic peaks, remain above 100 annually, and armed robberies are a constant threat in commercial corridors and transit stations.
Neighborhood-level variation is stark but offers little comfort. While affluent areas like Rockridge and Montclair have lower violent crime rates, they still suffer from high property crime. Conversely, neighborhoods like East Oakland, West Oakland, and the Fruitvale district experience both high violent and property crime. Even in "safer" pockets, residents cannot escape the citywide dysfunction—car thefts, package thefts, and home burglaries are universal. The progressive ideology that dominates Oakland's governance has created a two-tiered system: offenders are treated with sympathy and leniency, while victims are left without justice or recourse. For anyone considering a move to Oakland, the data and lived experience make clear that safety is a critical concern that cannot be overlooked.
* Values derived from national, state, county, city and local statistics and may differ in a specific area. Last updated: 2026-04-24T13:15:54.000Z
Narrative content on this page is AI-generated and may contain mistakes. Verify any details that matter before acting on them.
ReloMaps may earn a commission from affiliate links at no extra cost to you.