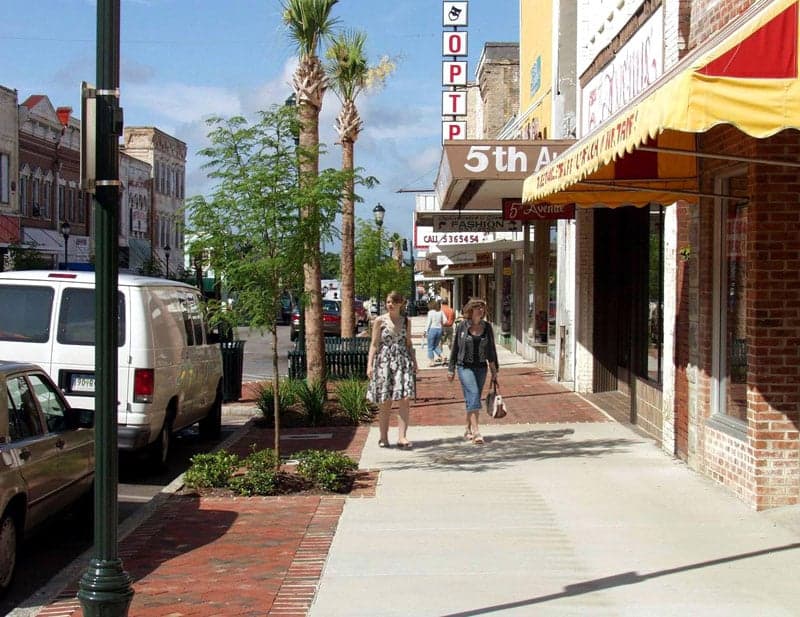
Photo: Wikipedia
Demographics of Orangeburg, SC
Affluence Level in Orangeburg, SC
A below-average socioeconomic profile. Incomes, home values, and educational attainment trail the U.S., with higher poverty and unemployment.
People of Orangeburg, SC
The people of Orangeburg, South Carolina, today form a predominantly Black (73.9%) community of 13,189 residents, a demographic profile shaped by deep agricultural roots and the enduring legacy of historically Black colleges and universities. The city is notably less diverse than the national average, with a White population of 23.2% and a foreign-born share of just 0.9% — one of the lowest in the state. College attainment stands at 27.2%, slightly below the national average, reflecting a workforce historically tied to manufacturing, education, and healthcare rather than high-tech or professional services. The city’s identity is strongly defined by its role as a regional hub for the surrounding rural counties, with a quiet, family-oriented character and a pace of life that remains distinctly Southern.
How the city was settled and grew
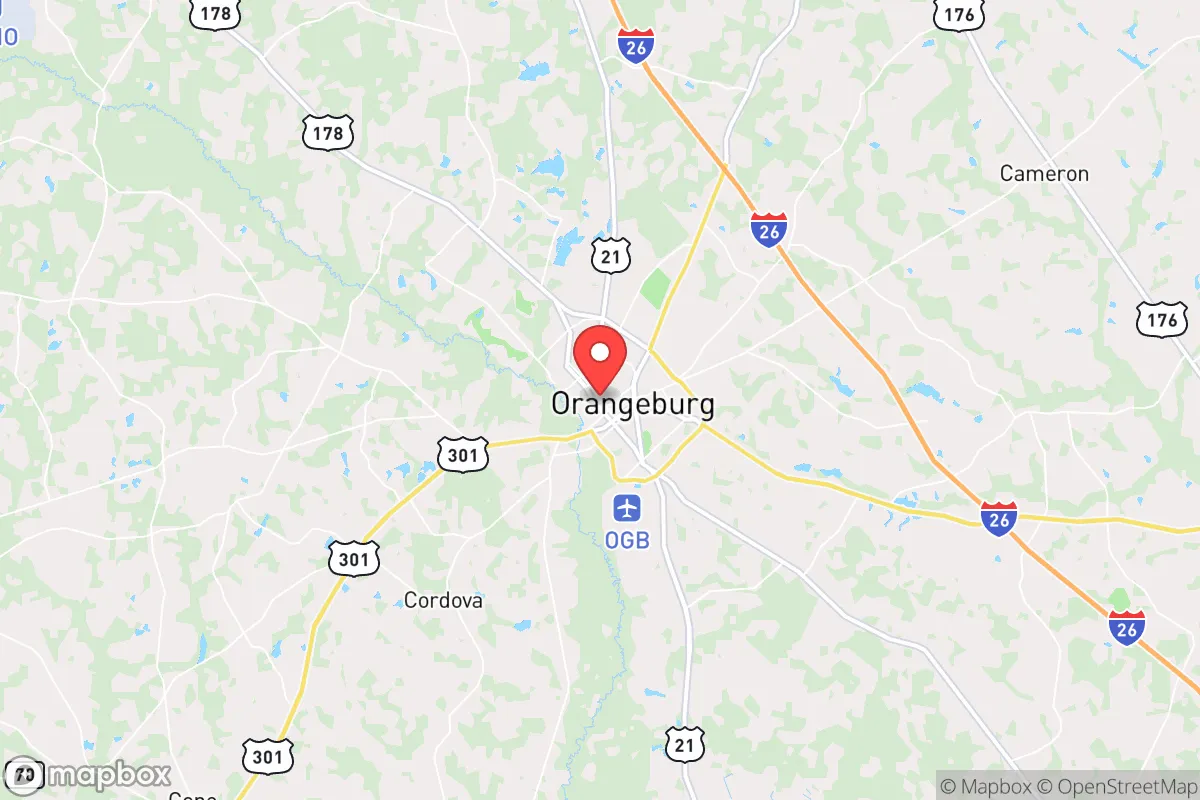
Orangeburg was founded in 1730 as a frontier outpost on the North Edisto River, part of a colonial land-grant system that attracted mostly Scots-Irish and German settlers. The original population clustered around the river crossing that became Russell Street, the historic commercial spine. By the early 1800s, the arrival of the railroad and the expansion of cotton plantations drew a large enslaved African population, who after emancipation formed the core of the city’s Black working class. These families settled in neighborhoods like Edisto Gardens (originally a freedmen’s settlement along the river) and Belleville, a historically Black district near the railroad depot. The late 19th and early 20th centuries brought a second wave: Jewish merchants from Eastern Europe, who opened dry-goods stores along Russell Street, and a small number of Italian and Greek immigrants who worked in the produce trade. By 1950, Orangeburg was roughly 60% Black and 40% White, with a tiny foreign-born population, a pattern that held until the Civil Rights era.
Modern era (post-1965)
The post-1965 period in Orangeburg was defined not by new immigration but by domestic migration and suburbanization. The 1968 Orangeburg massacre — in which state troopers killed three Black student protesters at South Carolina State University — accelerated White flight to the outskirts. Middle-class White families moved to subdivisions like Brookdale and Windsor Forest, while Black families expanded into previously White neighborhoods such as Dixie Hills and Edisto Drive. The city’s Black share rose from roughly 60% in 1970 to 73.9% today, while the White share fell from 39% to 23.2%. The foreign-born population remained negligible — 0.9% in 2024 — with no significant post-1965 immigrant wave. The small East/Southeast Asian community (0.9%) is largely composed of Vietnamese and Filipino families who arrived in the 1980s and 1990s, many working in the medical field at the Regional Medical Center. The Indian-subcontinent population is 0.0%, and the Hispanic share is just 0.2%, making Orangeburg one of the least ethnically diverse cities in South Carolina.
The future
Orangeburg’s population is projected to remain stable or decline slightly over the next decade, as out-migration of young adults to Charleston and Columbia offsets any natural increase. The city is not homogenizing into a single enclave but is instead tribalizing along race and class lines: Brookdale and Windsor Forest remain predominantly White and middle-class, while Belleville and Edisto Gardens are overwhelmingly Black and lower-income. The immigrant communities are too small to grow or plateau meaningfully — the 0.9% foreign-born share is essentially static. The biggest demographic shift will likely be the aging of the Black population, as younger families move to the suburbs of Columbia (30 miles north) for jobs and schools. South Carolina State University continues to attract a small number of Black students from outside the region, but most leave after graduation. The city’s future is one of slow decline in population and increasing racial concentration, with little in-migration to diversify the base.
For someone moving in now, Orangeburg offers a deeply rooted, predominantly Black community with a strong sense of place but limited economic opportunity and minimal ethnic diversity. The city is becoming more racially homogeneous and older, with few signs of the demographic churn that characterizes faster-growing parts of the state. New residents should expect a quiet, family-oriented environment where social networks are tight and the pace of life is slow — but also a place where the population is shrinking and the job base is narrow.
* Values derived from national, state, county, city and local statistics and may differ in a specific area. Last updated: 2026-05-01T00:38:34.000Z
Narrative content on this page is AI-generated and may contain mistakes. Verify any details that matter before acting on them.
ReloMaps may earn a commission from affiliate links at no extra cost to you.